AI-Ready Analytics: How to Turn Raw Ad Data Into Trusted Business Reports
Preparing ad data for reporting often feels like a messy chore. Analysts juggle scattered platforms, repeated SQL logic, and dashboards that stakeholders don’t fully trust. Clean, reliable data is what sets top analysts apart.

This guide shows how to prove your skills with a repeatable framework that delivers trusted, AI-ready dashboards business leaders actually use. We’ll cover the step-by-step process to centralize ad data, model business metrics, and deliver insights in tools like Google Sheets and Looker Studio.
Why Analysts Must Deliver AI-Ready Data Today
Marketing leaders are no longer satisfied with static, one-off reports. With AI reshaping decision-making speed, they expect insights that are consistent, trusted, and ready for activation. For analysts, this means shifting from ad-hoc reporting to building governed, AI-ready datasets that fuel campaigns, optimize spend, and prove ROI. Delivering this kind of data is no longer optional, it’s how analysts secure their influence in fast-moving marketing organizations.
Rising Pressure on Analysts to Keep Pace With AI
AI has accelerated the pace at which marketing teams expect answers. Leaders don’t want to wait through multiple rounds of data cleanup or reconciliation; they want campaign insights they can act on instantly.
Analysts who embrace AI-ready practices minimize manual wrangling, deliver attribution and performance metrics faster, and elevate their strategic value. Those who ignore this shift risk being sidelined by automated platforms that can handle routine reporting but lack the depth of human-driven analysis.
Why Business Leaders Demand Governed, Not Raw, Data

Marketing executives don’t want scattered spreadsheets or dashboards where conversion rates and ROI don’t line up. They expect governed data: unified definitions for key metrics, standardized attribution models, and reusable pipelines that keep reporting consistent across campaigns and channels.
When analysts deliver governed data, they give business leaders the confidence to make spend decisions quickly, knowing that the numbers are accurate and repeatable. This is why data governance has become a business-critical priority, not just a back-office function.
How AI-readiness Safeguards Analyst Career Growth
Analysts who can produce AI-ready data become indispensable in marketing organizations. By building transparent dashboards with consistent KPIs – from CAC to lifetime value – they show mastery over both data integrity and insight delivery.
This positions them as trusted partners in scaling AI-driven marketing strategies. Instead of fearing automation, they use it to amplify their impact, ensuring long-term career growth, credibility with leadership, and a clear path to more strategic roles.
Key Challenges Analysts Face When Working With Raw Ad Data
When it comes to creating AI-ready data for the marketing function, the biggest challenge is undoubtedly handling raw data from multiple ad platforms. The process of working with raw ad data often leads to wasted time, repeated SQL, and mismatched reports. This section highlights the biggest challenges analysts face before creating trusted, AI-ready dashboards.
Scattered Ad Platforms and Manual Exports Waste Time
Ad data lives across platforms like Facebook, TikTok, or LinkedIn, each with its own export process. Analysts spend countless hours downloading CSV files and stitching them together just to prepare basic reports. This repetitive work leaves little room for real analysis. Centralizing all ad data in one warehouse eliminates manual exports, ensures consistent storage, and allows analysts to deliver insights faster while avoiding unnecessary errors.
SQL Duplication Leads to Conflicting KPIs
Without a semantic layer, marketing analysts waste hours rewriting SQL for the same KPIs – like CAC, ROI, or MQL-to-SQL conversion – across different dashboards. Even tiny variations in how these metrics are calculated can produce conflicting numbers, leaving campaign teams debating accuracy instead of acting on insights. This inconsistency erodes trust and slows budget decisions.
Data Silos Break Trust in Reporting Across Teams
When departments like marketing, sales, and finance build reports in silos, chaos follows. Marketing may track ad spend one way, while finance pulls the same data differently for P&L reporting. Even small differences in how CAC, ROI, or revenue attribution are calculated create conflicting numbers – leaving leadership unsure which version to trust.
What Makes Marketing Analytics Truly AI-Ready
AI-ready analytics is more than just clean data. It ensures that KPIs are defined consistently, calculation logic is fully transparent, and every report aligns across tools. These are the elements that make analytics reliable for business leaders, explainable for analysts, and usable by AI systems.
Standardized Metrics That Can Be Reused Everywhere
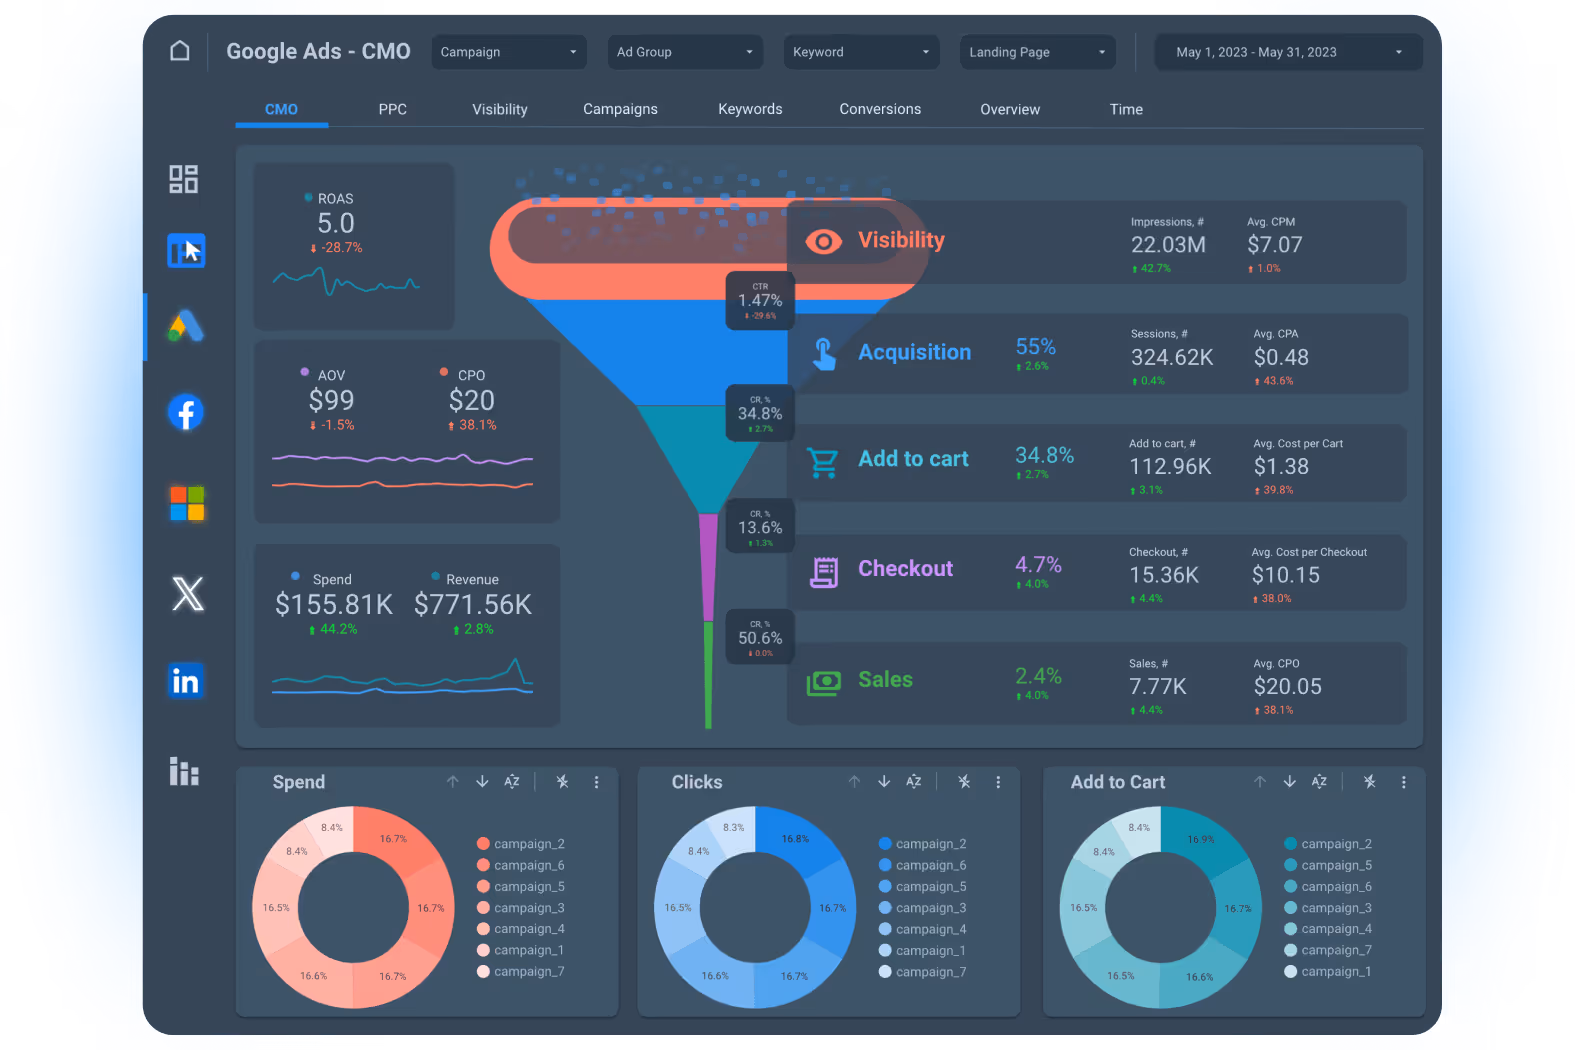
AI-ready analytics starts with defining KPIs once and reusing them everywhere – across dashboards, reports, and activation tools. When metrics like ROAS, CAC, or LTV are modeled in OWOX Data Marts, analysts eliminate SQL duplication and prevent conflicting results. Standardization speeds up reporting, saves hours of rework, and gives marketing teams the confidence that every number means the same thing in every context.
Transparent Logic That Documents How KPIs Are Defined
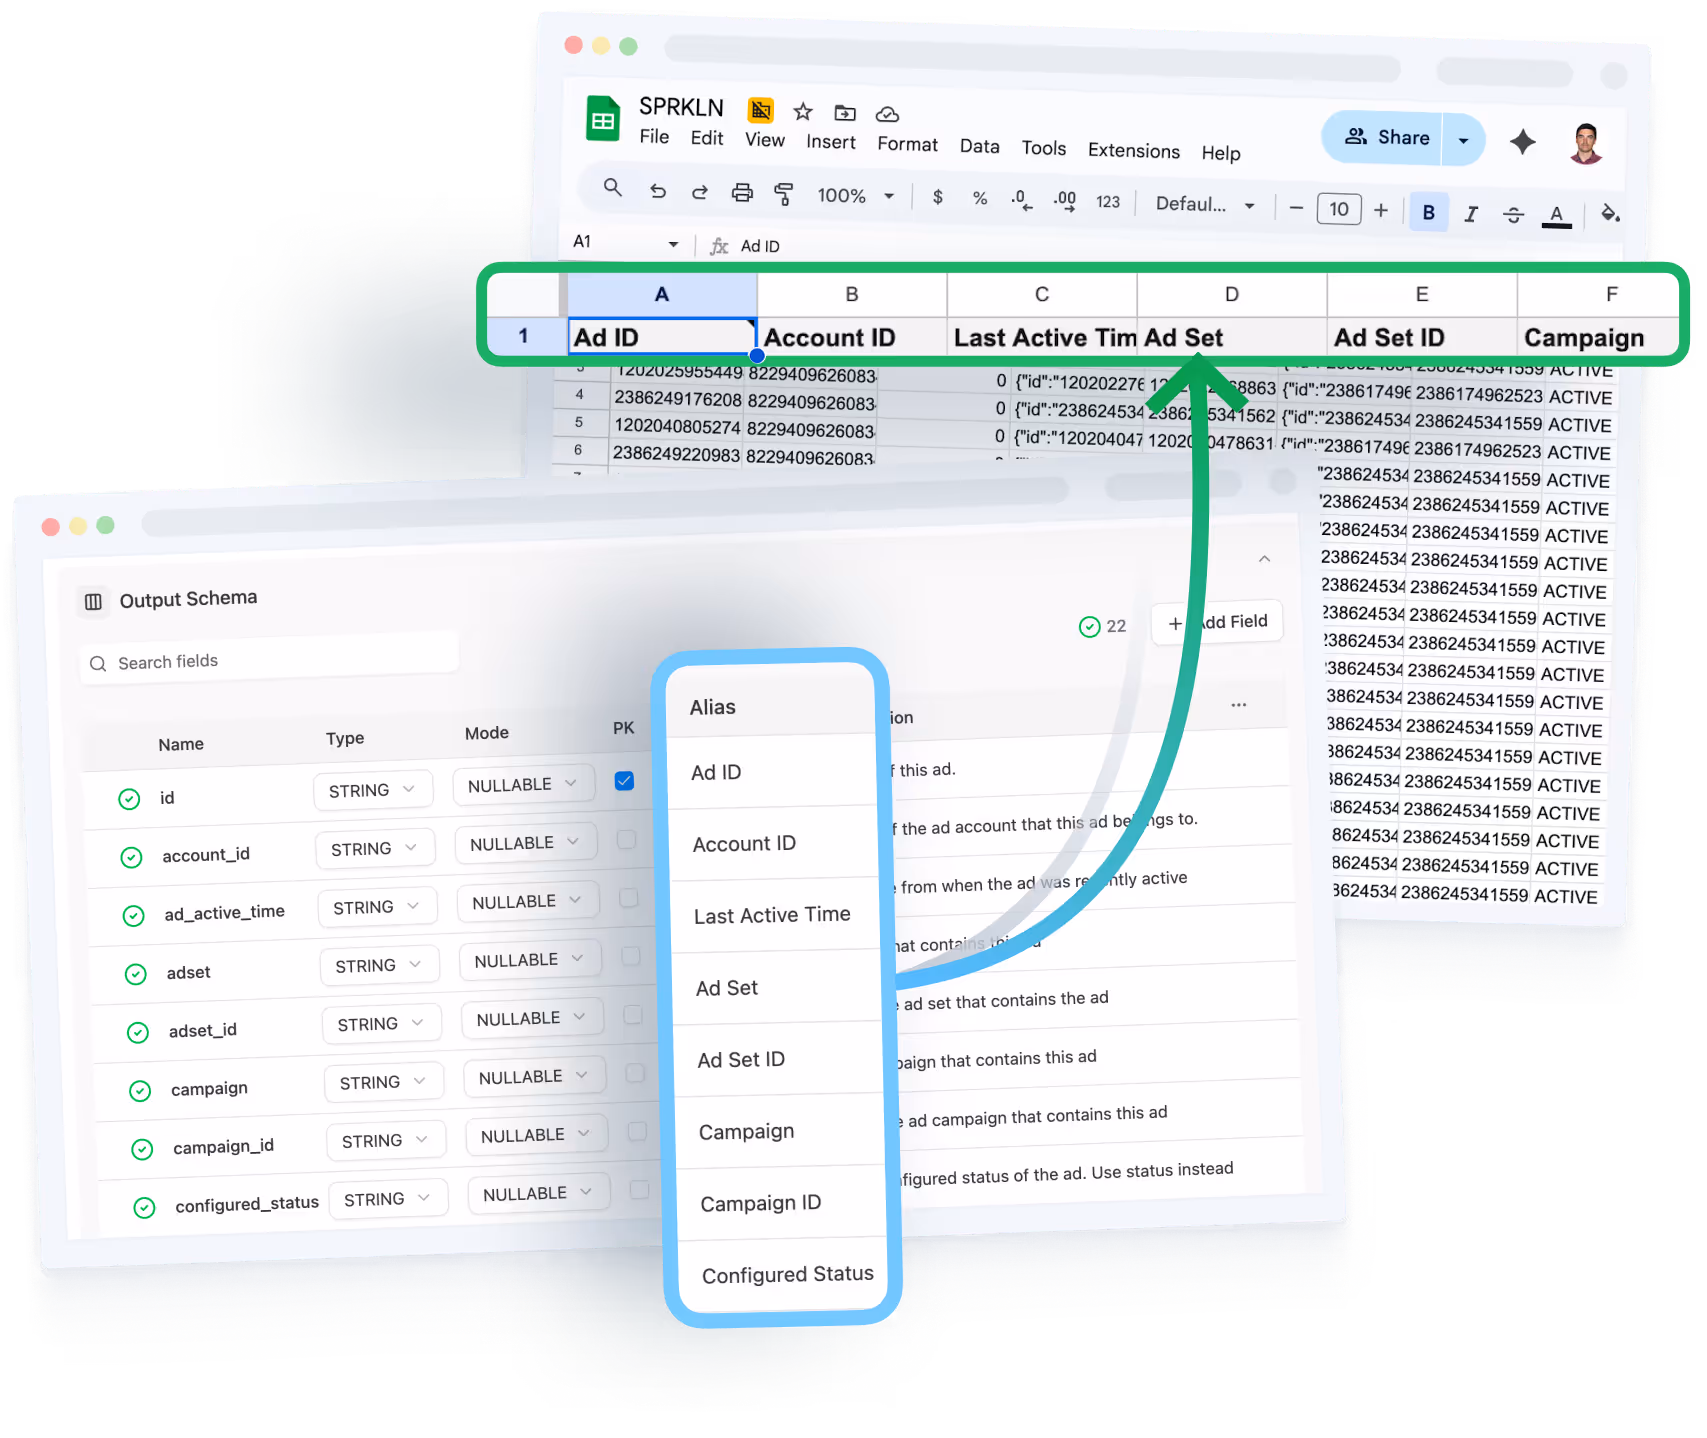
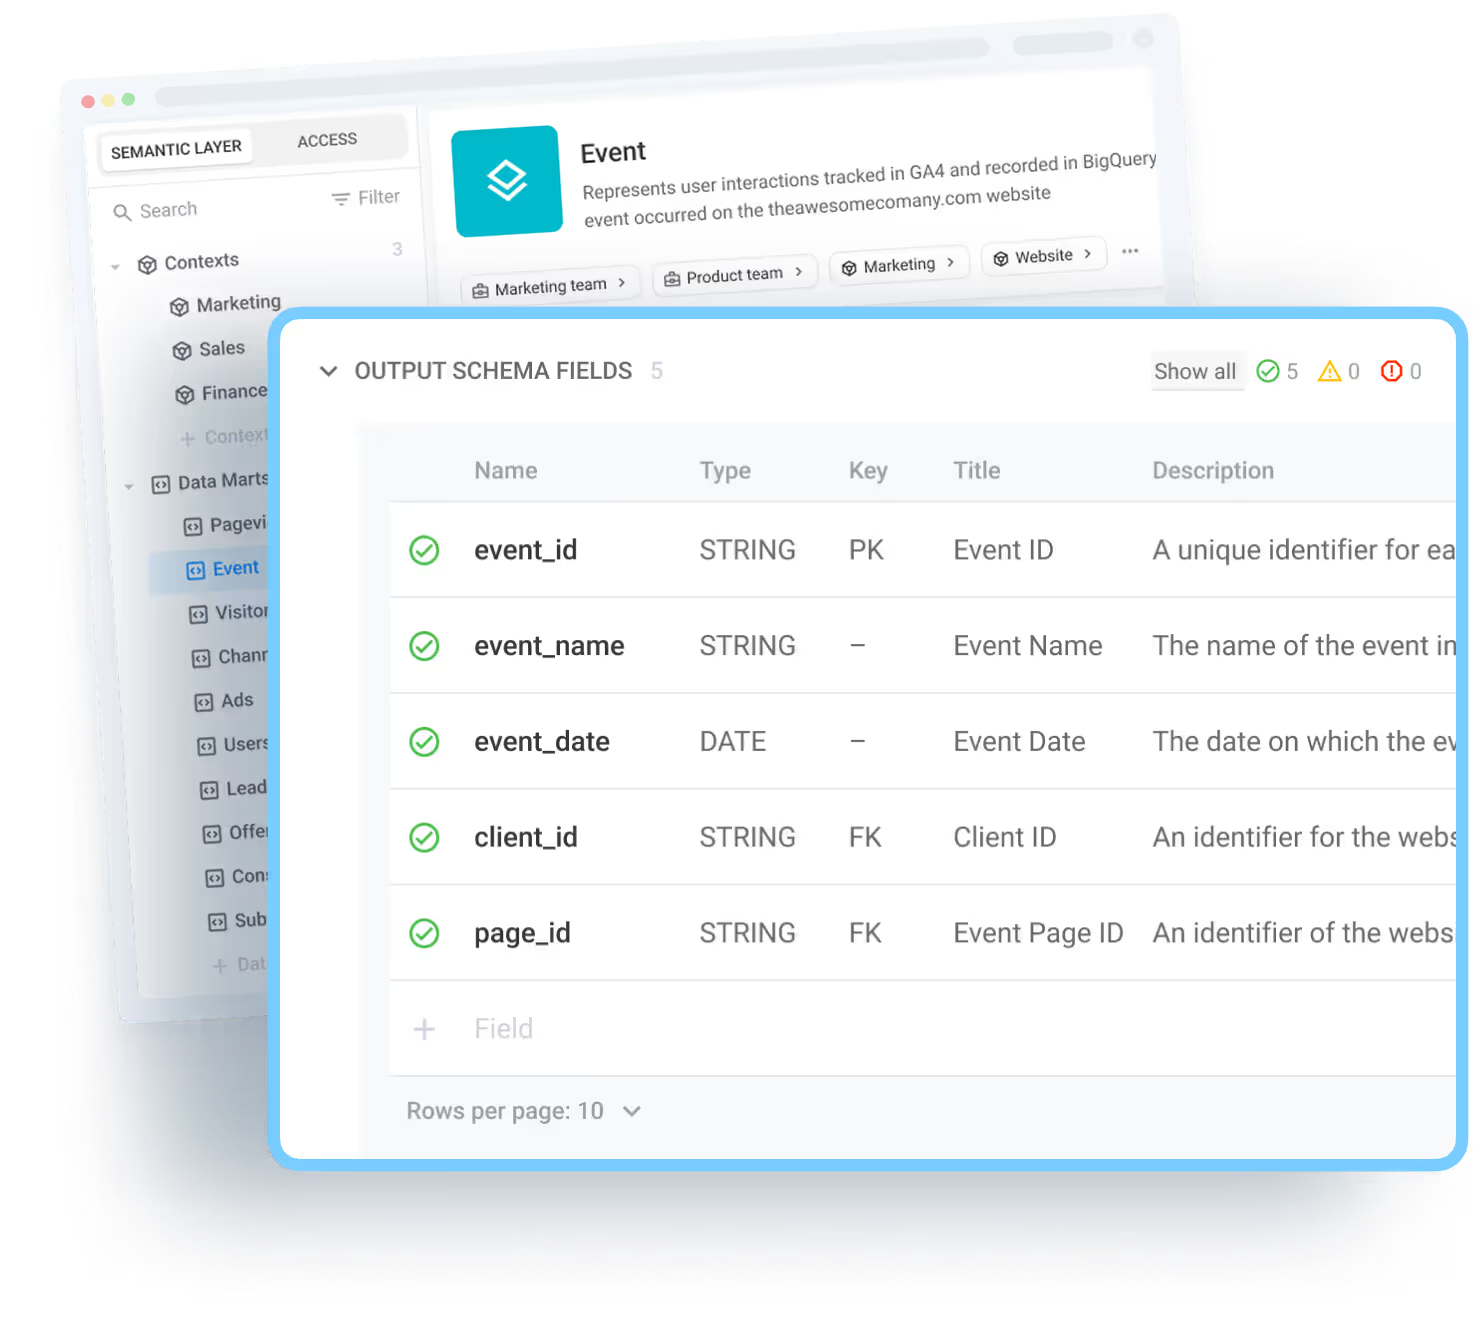
Business teams need to see how numbers are calculated, not just the outputs. With OWOX Data Marts, analysts can annotate each metric with aliases, descriptions, and definitions. Documenting KPI logic makes reporting transparent, builds cross-team trust, and allows both AI systems and business stakeholders to interpret results confidently – without relying on black-box metrics.
One Governed Source of Truth Shared Across Tools
When marketing, sales, and finance teams each create their own reports, misalignment is inevitable. OWOX Data Marts solve this by acting as a governed semantic layer: a single source of truth that feeds every tool. Whether the data is exported to Google Sheets for campaign reviews or Looker Studio for executive dashboards, the same verified dataset flows everywhere. This keeps stakeholders aligned, reduces reconciliation work, and ensures faster, more confident decision-making.
Step-by-Step Framework to Transform Raw Ad Data into AI-Ready Data
Turning raw ad data into AI-ready Data requires a clear process. This section explains a three-step framework analysts can follow to centralize, model, and deliver business-ready reports efficiently.
Step 1: Centralize Ad Data in a Warehouse Like BigQuery
Centralizing ad data is the first step to reliable reporting. By moving everything into one warehouse, you save time, remove scattered workflows, and build a trusted foundation for analysis.
- Set Up OWOX Data Marts: Begin by installing OWOX Data Marts on the cloud or a local host. This prepares your workspace to handle data connections and keeps everything ready for the next steps.
Follow the official guide for smooth setup and troubleshooting if needed.- Open OWOX Data Marts and click New Storage.
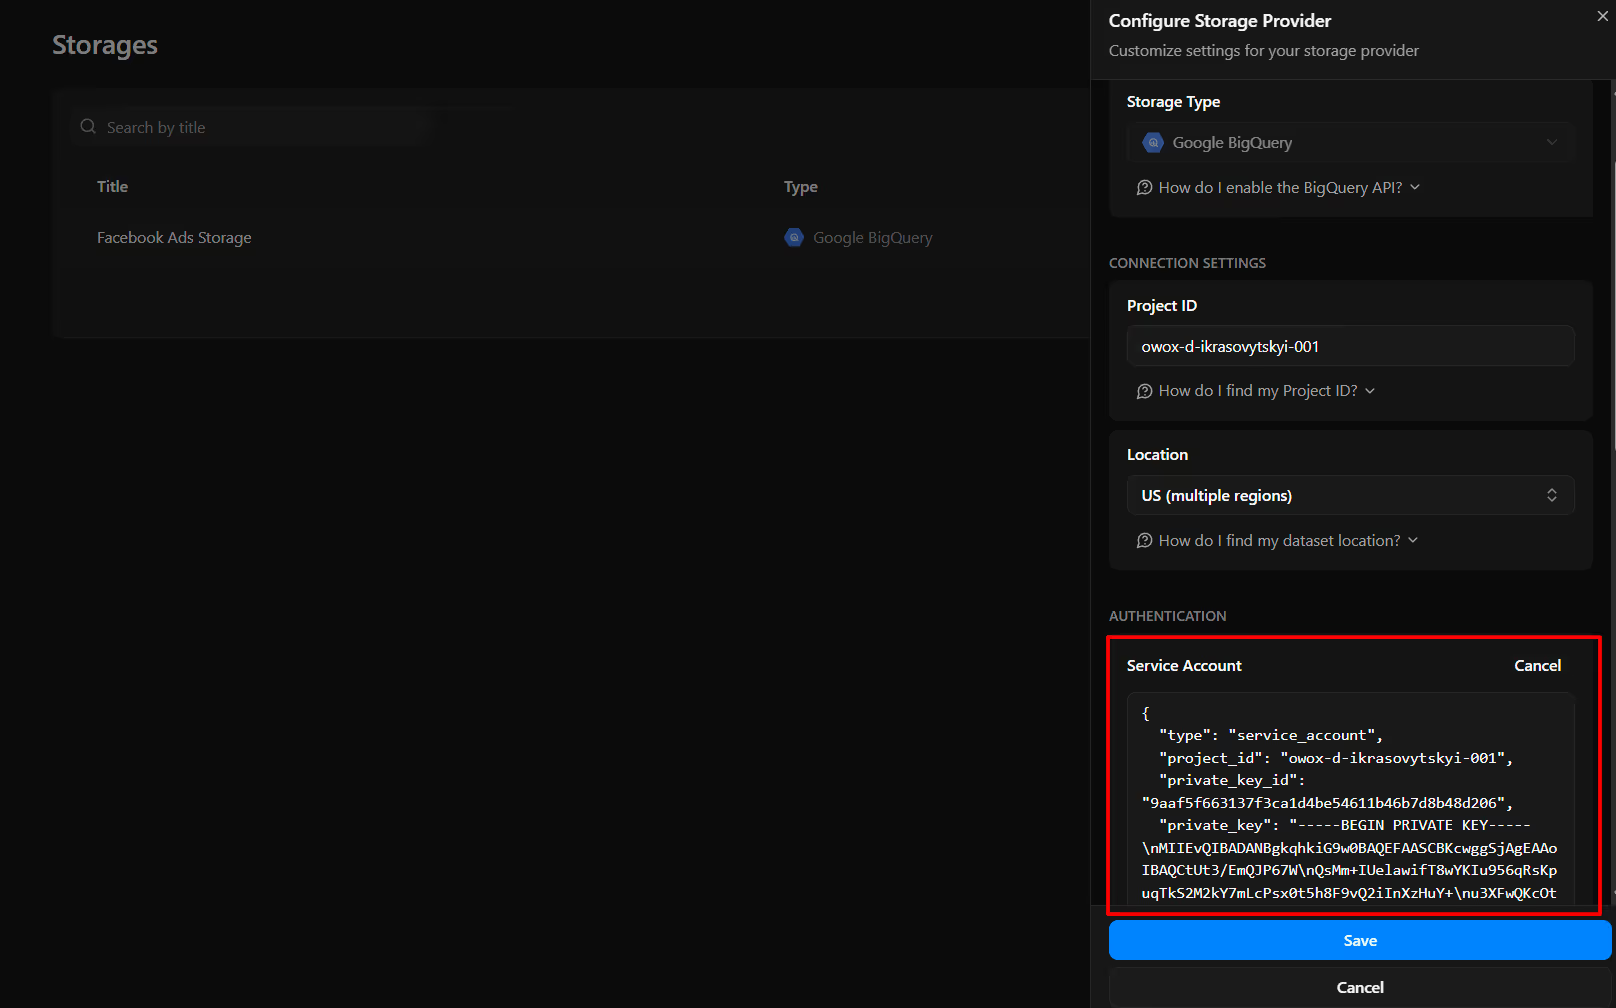
- Select Google BigQuery as the storage type.
- Fill in the details such as Title, Project ID, and Region to match your BigQuery setup.
- Add the Service Account details.
- Once saved, your storage is ready to link with Data Marts.
- Link Ad Accounts as sources: After storage is ready, create a Data Mart and attach the sample ad accounts as sources.
- Add a Title and Data Storage (created previously) to Create Data Mart.
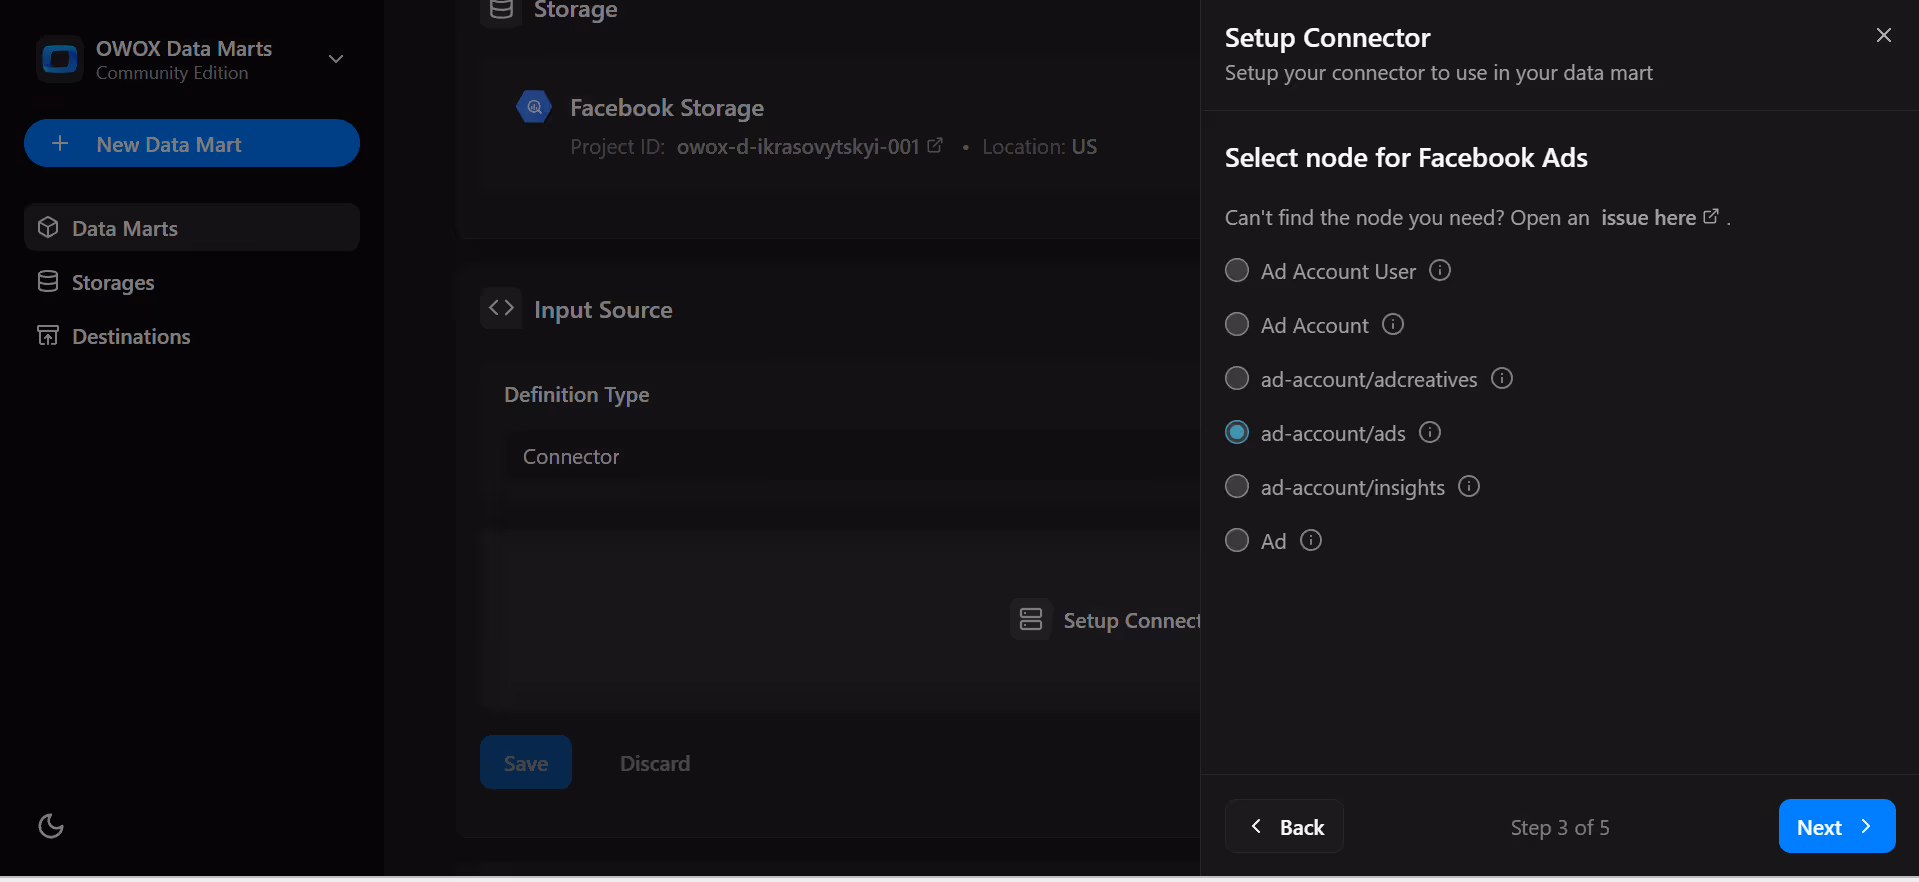
- In the Input Source panel, select Definition Type and then click Setup Connector.
- Configure parameters: Each connector has a set of required parameters, select the one based on your output requirements.
- Add Access Credentials for the Ad account chosen. Each connector requires authentication. You can refer to our guide for the step-by-step instructions on how to get the credentials from any available source.
- Select the node you want to import in this data mart. Create a separate Data Mart for each node you want to pull data from.
- Next, click "Select all" or select only the fields you want to store in your data warehouse.
- Enter the dataset name for your data storage (e.g., dataset name for BigQuery) where the connector can load the data. The dataset will be created automatically if it doesn’t exist.
- The table name will be created automatically based on the selected node name.
- Click Save in the Data Setup tab.
- Once your Data Mart is defined and saved, click Publish Data Mart to generate the output schema and make the data ready for analysis. This ensures ad data is consistent, fresh, and free from manual CSV exports before you schedule automated refreshes. Publishing the Data Mart creates base tables like ad_campaigns, ad_ads, and ad_daily_stats, each with essential fields such as date, account_id, campaign_id, cost, clicks, and impressions.

- You can run the Data Mart manually at any time to check if the data has loaded successfully.
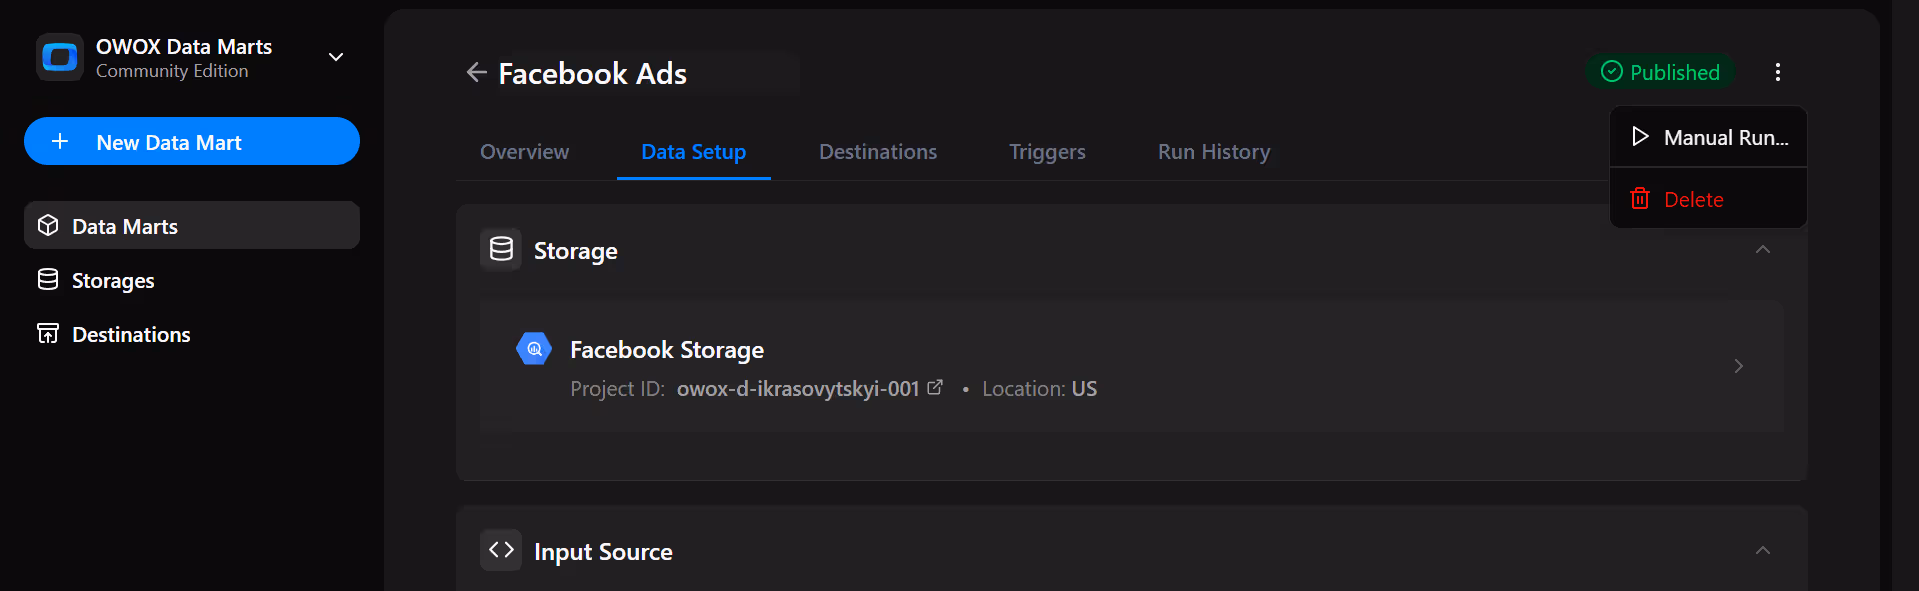
- For ongoing updates, add a Report Trigger to refresh the data on a schedule. This ensures your warehouse always has the latest ad performance, ready for dashboards and analysis.

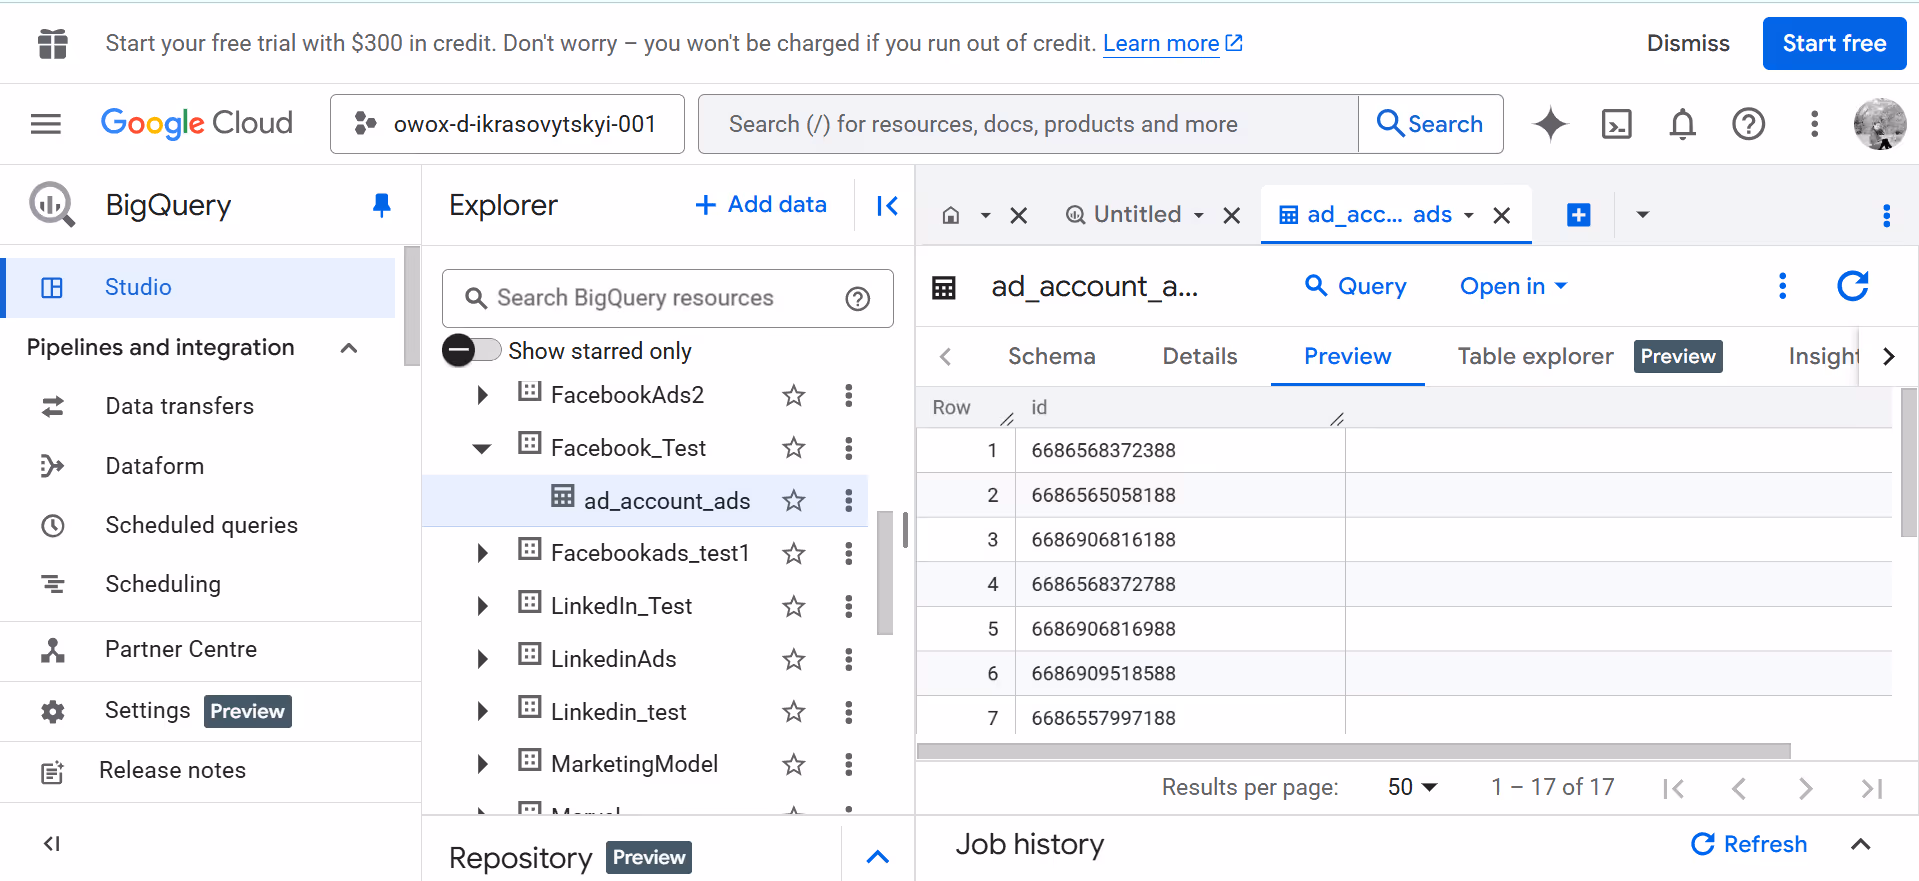
- Check that your ad data is now available in BigQuery by opening Google Cloud Console, selecting your project and dataset, and previewing the created table to confirm successful import.
Step 2: Model Business-friendly Metrics Such as ROAS or CAC
Once you’ve created a connector-based Data Mart, the tables it generates in BigQuery can be reused as the input source for an SQL-based Data Mart. This lets you build new marts on top of clean, imported ad data, apply joins or transformations, and keep everything consistent without starting from scratch.
Creating business-friendly metrics ensures stakeholders understand and trust the numbers. Instead of repeating SQL logic across dashboards, you define KPIs once and make them reusable everywhere.
- Show SQL Duplication Pain Quickly: Start by looking at how the same KPI is written differently in SQL across multiple reports. These inconsistencies highlight why duplication causes errors and weakens trust in dashboards.
- Create a Data Mart for ROAS or Revenue: Next, build a new Data Mart in OWOX for a key metric such as ROAS or Revenue. The process is simple:
- Create a New Data Mart by clicking + New Data Mart, giving it a title, selecting your storage (BigQuery), and clicking Create.
- Choose Definition Type – SQL in the Input Source panel, then write or paste your query into the SQL editor, validate it, and save (don’t forget to Publish).
Tip: Focus each query on one business question for reusability and clarity. - For example, define ROAS as revenue/cost (excluding refunds and ensuring currency is normalized), or CAC as total_cost / unique_conversions (deduplicated by user_id and date). These guardrails keep KPIs consistent across every report. This central definition becomes the single source of truth for your reporting.
- Add Business-friendly Aliases, Descriptions, and Logic: Finally, enrich the Data Mart by adding clear names, explanations, and business logic for each field. This documentation ensures metrics are easy to interpret and can be reused confidently across teams.

Step 3: Deliver Reports Through Google Sheets and Looker Studio
Once metrics are modeled, the final step is sharing insights in the tools teams already use. Exporting your Data Mart into Sheets or Looker Studio ensures governed data is accessible without extra SQL or manual rework.
- Export the Data Mart into Google Sheets and Looker Studio: Send the modeled Data Mart directly into Google Sheets or Looker Studio. This makes your trusted metrics instantly available in familiar tools.
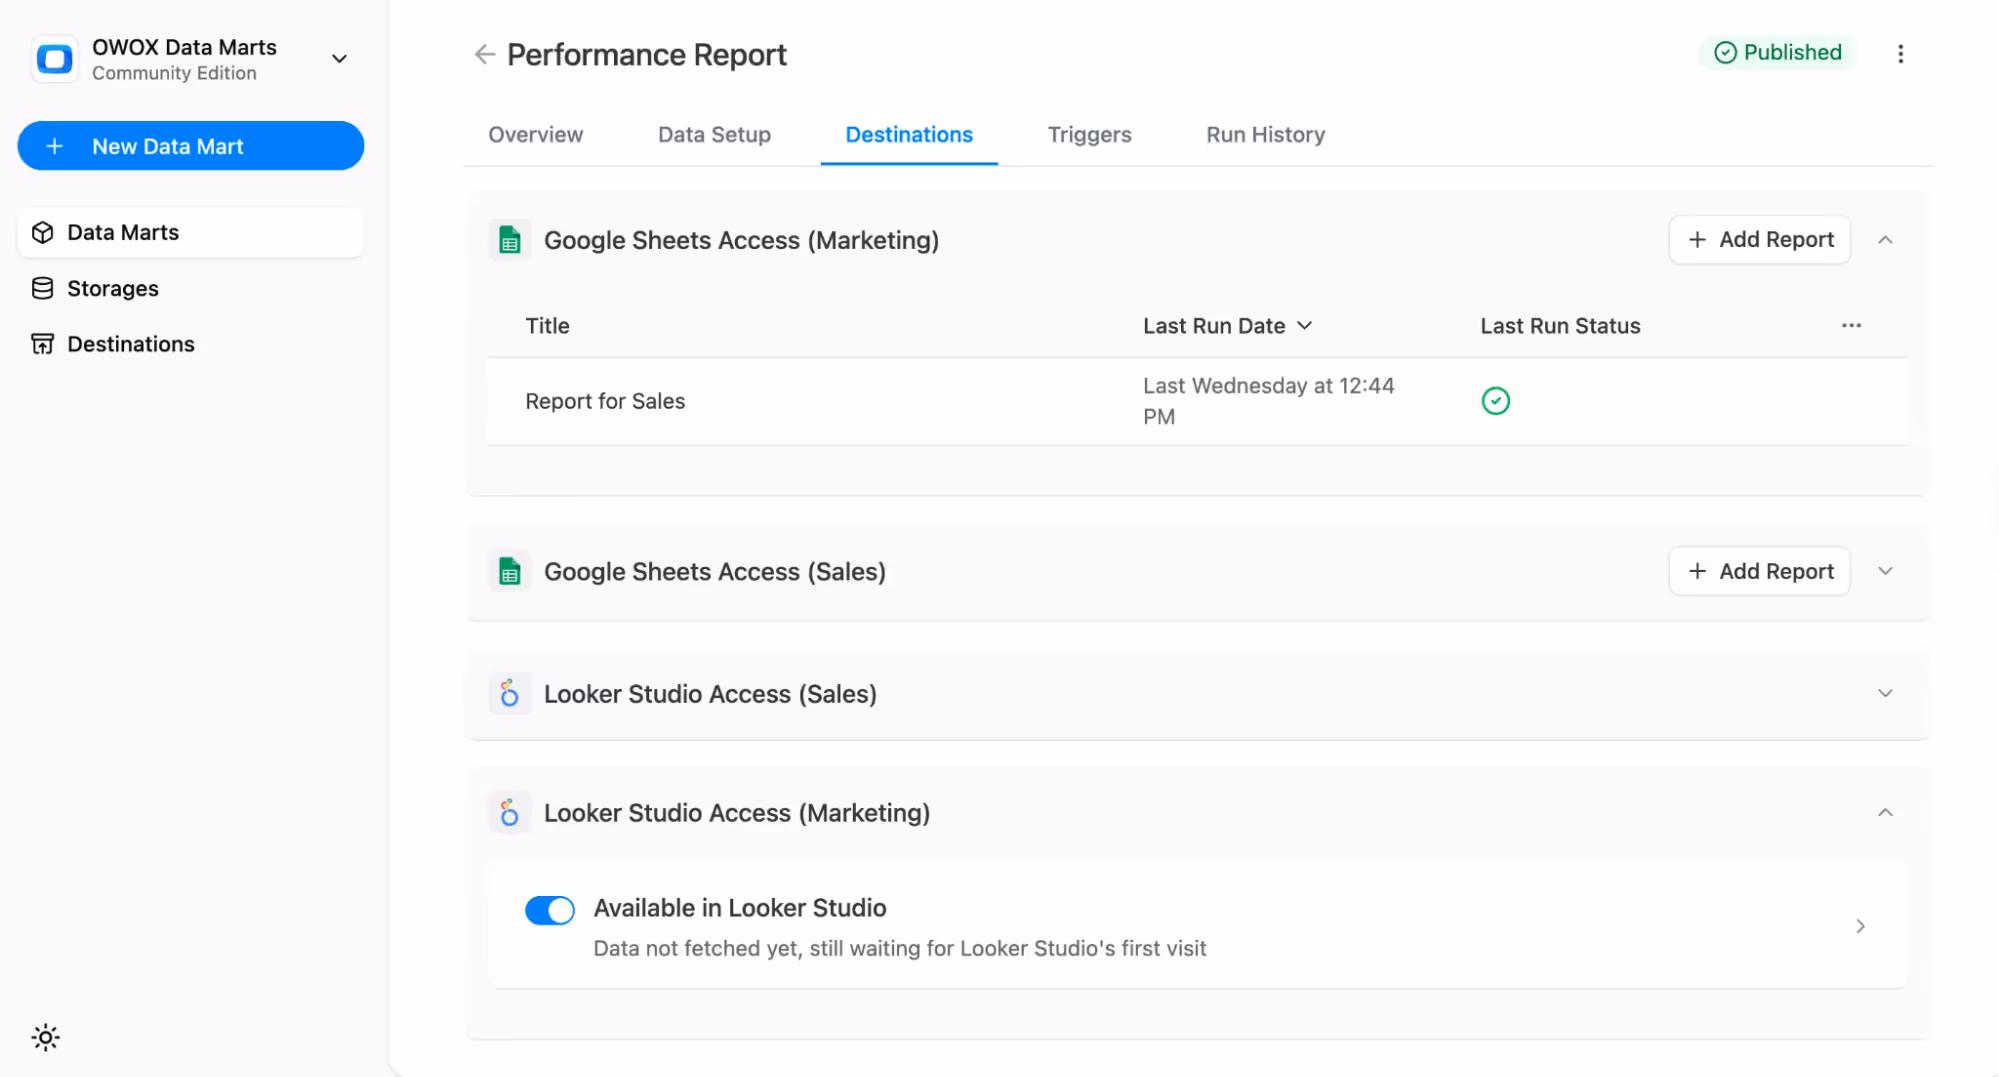
- Reuse the Same Metric Across Dashboards: The KPI you defined with an Alias and Description once in OWOX Data Marts is now reusable across multiple dashboards. Every team sees the same number, avoiding conflicts and confusion. The same ROAS metric can drive a month-over-month trend chart in Looker Studio and a cohort pivot in Sheets, without rewriting SQL or changing definitions. One definition powers all destinations.
- Build Dashboards for Analysis: With data in Sheets or Looker Studio, teams can create pivots, charts, and dashboards tailored to their needs, all powered by consistent, verified logic.
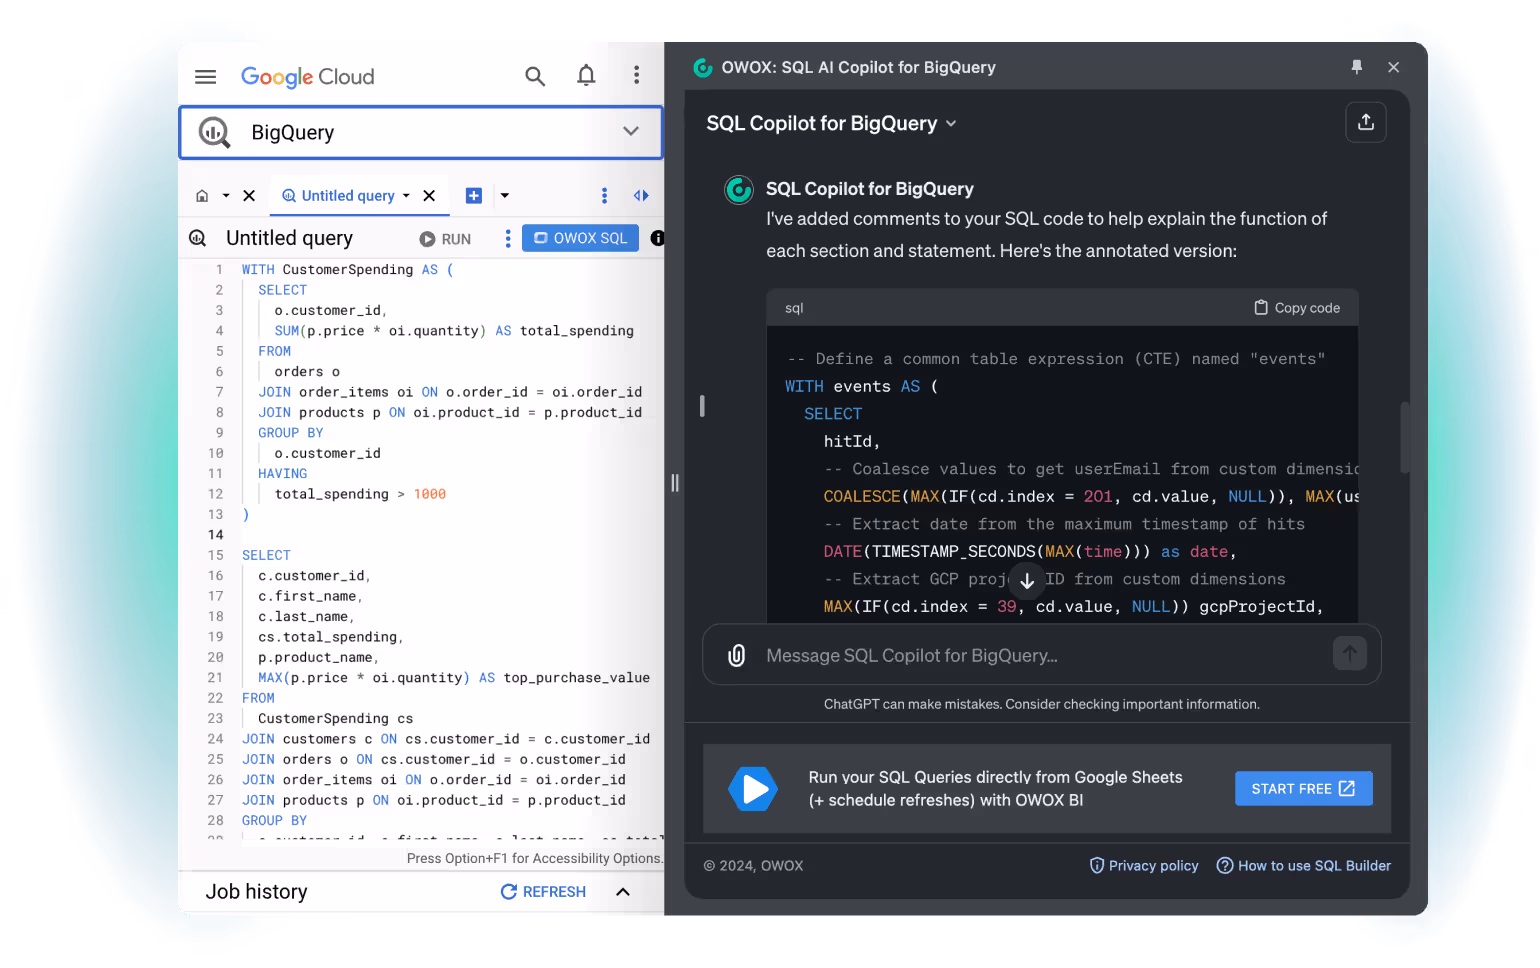
- Ask AI to Explain and Suggest: AI copilots can now interpret these governed metrics, answering questions or suggesting insights. This adds clarity while keeping results aligned with your defined business logic.
What Makes a Marketing Analytics Report Truly Trustworthy
A good-looking dashboard isn’t enough to win stakeholder confidence. True trust comes from accuracy, consistency, and repeatability. Below, we’ll explore the elements that make analytics dependable.
Accuracy Matters More Than Dashboard Design
Flashy visuals can grab attention, but they mean nothing if the underlying numbers are wrong. Accuracy is the foundation of any trustworthy report. By relying on governed data pipelines, analysts ensure that metrics are consistent, validated, and free of errors.
This reliability allows teams to focus on insights instead of questioning the numbers. When accuracy is prioritized, dashboards become tools for confident decision-making rather than sources of debate, strengthening trust in both analytics and the analysts behind them.
Ensuring Consistency Across Teams With Governed Metrics

Conflicting KPIs across departments often create unnecessary debates and slow down decision-making. Centralizing metric definitions ensures that every team works with the same trusted numbers, removing confusion and duplication.
When analysts define KPIs once and make them reusable across tools, reports become consistent and reliable. This alignment not only speeds up collaboration but also builds confidence that everyone is using the same source of truth
Making Analytics a Portfolio-ready Asset
Reports shouldn’t be treated as temporary deliverables that get forgotten after a meeting. A well-structured dashboard shows the full range of an analyst’s skills, from collecting raw data and modeling metrics to presenting insights in a clear, consistent way. When designed for repeatability, these dashboards become valuable portfolio artifacts.
Documenting Business Logic for Long-term Trust
Transparency is a cornerstone of trustworthy analytics. When analysts clearly document metric definitions, joins, and transformations, they remove ambiguity about how numbers are calculated. This practice allows business users to understand the data they rely on and ensures AI systems can interpret results correctly.
Well-documented logic reduces confusion, speeds up onboarding for new team members, and provides clarity during audits or stakeholder reviews.
Automating Updates to Keep Dashboards Reliable
Outdated dashboards quickly lose credibility, no matter how well they are designed. Automated refreshes ensure that reports always reflect the latest data, reducing the risk of errors and cutting down on repetitive manual work.
With report triggers in OWOX Data Marts, analysts can schedule updates to run daily, weekly, or at custom intervals.
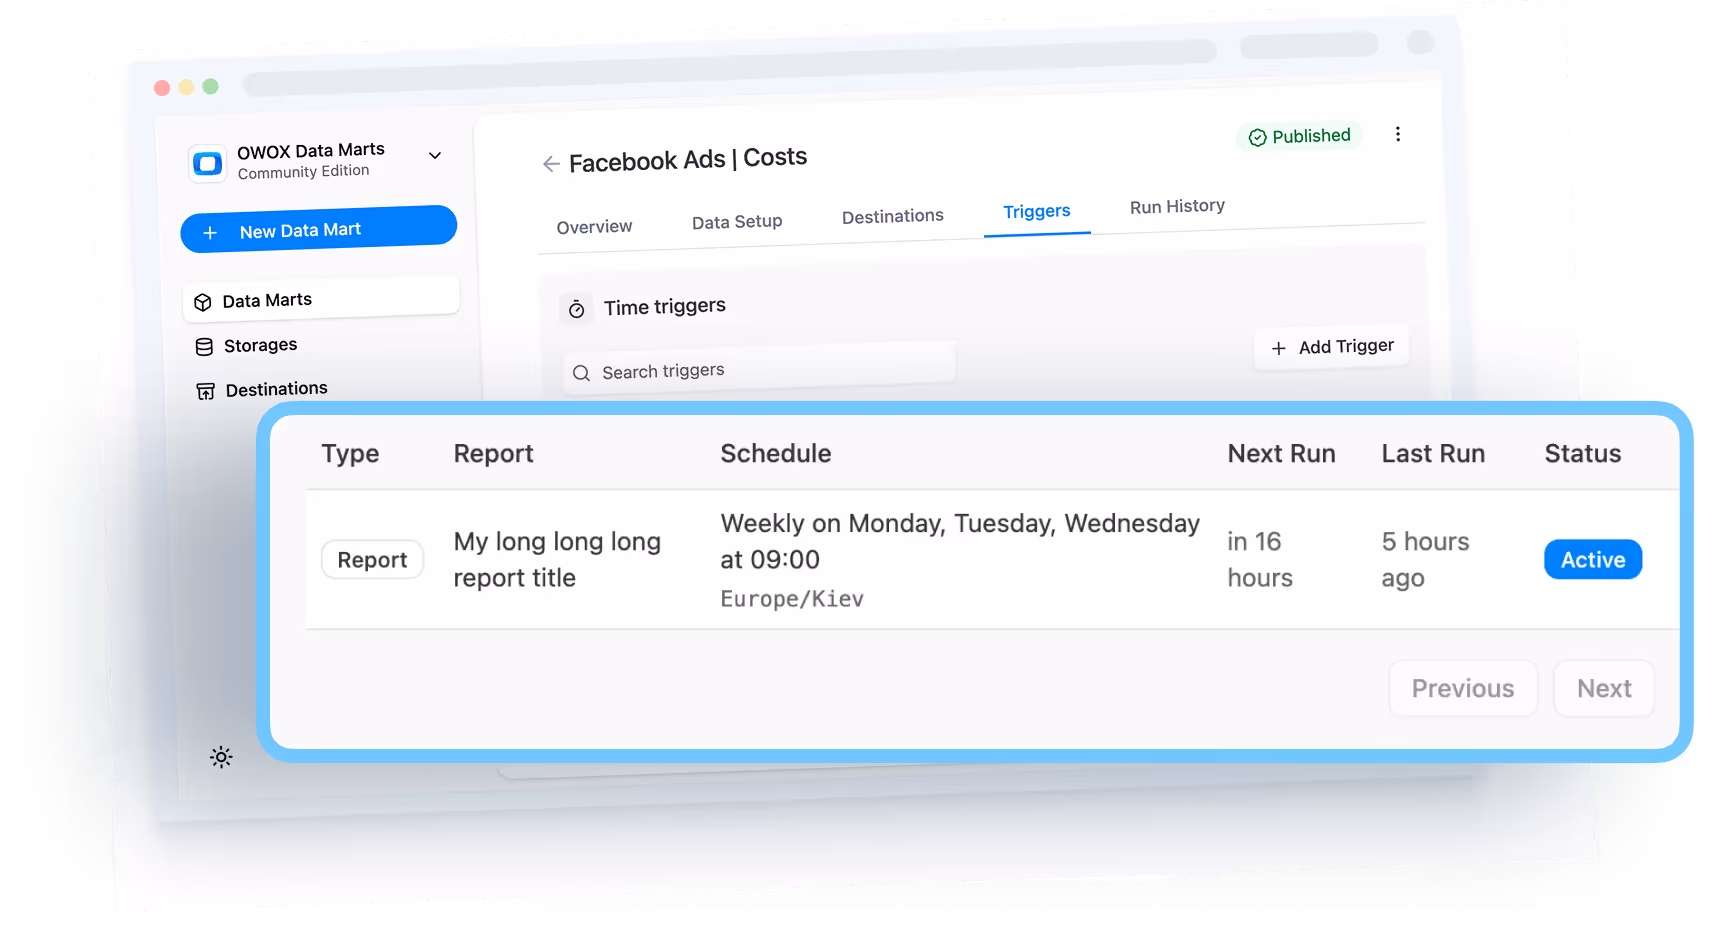
This automation keeps dashboards reliable, saves valuable time, and allows teams to make decisions with confidence based on accurate, up-to-date information.
Start Building AI-Ready Dashboards with OWOX Data Marts Community Edition
The OWOX Data Marts Community Edition gives analysts everything needed to prepare AI-ready data pipelines at no cost. Use open-source connectors to centralize ad data, model reusable business metrics in SQL, and deliver governed reports directly to Google Sheets or Looker Studio.
With full transparency, privacy-first design, and no vendor lock-in, the Community Edition is ideal for building dashboards that are both production-ready and portfolio-worthy, helping analysts prove their skills with trusted business insights.
Explore the GitHub repository to get started. Build once, reuse everywhere, and prove your ability to deliver trusted insights that scale.
FAQ

%202.png)


.png)