How to Build a Free Modern Analytics Stack with JavaScript, SQL, BigQuery & OWOX
Paying monthly just to get your data in one place? There’s a better way. Many analysts, marketers, and small teams struggle with expensive tools, limited access, or endless CSV downloads. If you’re tired of these issues and want more control without the high cost, you’re not alone.
In this guide, you’ll learn how to combine JavaScript-powered connectors, SQL, BigQuery’s free tier, and OWOX Data Marts to create a cost-free pipeline that connects marketing ad platforms like Facebook Ads, Twitter Ads, TikTok Ads, stores your data in BigQuery, transforms any BigQuery data stored with SQL logic, and delivers live dashboards in Google Sheets or Looker Studio. Full transparency, no vendor lock-in, zero subscription costs.
What Is a Modern Analytics Stack and Why It Matters Today
A modern analytics stack is a set of connected tools used to gather, store, and analyze marketing and business data in one place. It helps teams avoid silos, reduce manual work, and get faster answers to important questions. By combining data from various sources and turning it into usable insights, this process enables smarter, more effective decision-making.
Here are some key benefits:
- Centralized data storage lets you view all your marketing and customer data in one place, instead of jumping across tools.
- Seamless data integration pulls data from multiple platforms automatically, reducing manual work and making your reports more accurate.
- Real-time data access allows you to see campaign performance instantly and make quick adjustments when something isn’t working.
- Advanced analytics helps you spot patterns, forecast results, and tailor your marketing based on what the data actually shows.
- Improved ROI tracking means you can see which channels bring results and shift your budget to what’s actually working.
- Better customer segmentation allows you to group customers by behavior or interest, so your campaigns can be more targeted and effective.
- Stronger marketing attribution helps you understand which touchpoints lead to conversions and improve how you measure campaign success.
- Smarter marketing automation enables timely, targeted actions like sending emails or ads based on customer activity, without doing it manually.
- Improved team collaboration lets marketing, sales, and support share the same insights and work toward shared goals using the same data.
- Built-in scalability means your stack can grow with your business, handling more data and more users as your needs increase.
How to Build a Nearly Free Analytics Stack with JavaScript, BigQuery, SQL & OWOX
You can build a complete analytics stack without relying on expensive SaaS tools. Google BigQuery offers a generous free tier, up to 10 GB of storage and 1 TB of query processing each month, which is often enough for analysts or growing teams.
Google Ads & Google Analytics (GA4) data can be imported directly into your Google BigQuery.
💡If you need help with the same, you can check our articles: How to Upload Google Ads BigQuery Raw Data in 2025 and Google Analytics 4 to BigQuery - A Step-by-Step Guide
With OWOX Data Marts (Community Edition), you can use the free, open-source connectors to pull in ad data and ad spend from non-Google Ad platforms like Facebook, TikTok, and LinkedIn, without writing code. The data lands in BigQuery, ready to be transformed with SQL Queries into clean, analysis-ready tables.

Reporting is flexible too; you can use Google Sheets or Looker Studio as data destinations to share insights with your team using the structured data already in BigQuery. And because the entire system is open and customizable, it works just as well for product and sales data as it does for marketing.
This isn’t a workaround; it’s a modern, scalable stack designed for transparency, speed, and cost-efficiency. Built for teams that want answers, not complexity.

Core Components of a Fully-Free Analyst Stack
To build your own modern analytics stack, without subscriptions or vendor lock-in, you need just a few key components. Think of it as a DIY system: pull in raw data with OWOX connectors, store and query it using BigQuery’s free tier, and model everything with SQL to create clean, business-ready reports.
Data Sources
Every analytics stack starts with raw data. This includes data from platforms like Facebook Ads, LinkedIn Ads, and other ad platforms. APIs and internal databases also feed into the system. These are the starting points for everything that follows.
When these sources remain separate, it’s hard to get a full picture. That’s why a modern stack brings all this data together. Having a unified foundation avoids duplicate reporting, fills data gaps, and makes it easier to analyze customer behavior across multiple touchpoints.
Data Integration (Ingestion)
Once you know where your data is coming from, the next step is bringing it into your system. This process is called ingestion. Instead of relying on manual CSV exports or expensive SaaS tools, you can use open-source connectors from OWOX to automatically pull data into your warehouse. OWOX’s open-source ingestion layer is built in JavaScript, giving you flexible, code-controlled access to marketing and analytics APIs.

Modern stacks often use the ELT method to extract the data, load it into storage, and then transform it later. This allows you to ingest raw data in real time and handle large volumes quickly. It also gives you more flexibility in how and when you process that data.
Data Storage (Warehouse)
After ingestion, your data needs a reliable home. Cloud-based storage systems like Google BigQuery are ideal for this. They’re easy to manage, scalable, and accessible from anywhere. BigQuery’s free tier even gives you 10 GB of storage and 1 TB of query processing each month, perfect for small teams or early-stage projects.

Storing your data centrally allows everyone on your team to work from the same source of truth. Whether you're analyzing past performance or building new reports, having everything in one place keeps things consistent and avoids version conflicts across tools.
Data Transformation (Data Marts / SQL Modeling)
Raw data isn’t very helpful until it’s cleaned and structured. Using SQL in OWOX Data Marts, you can turn unorganized records into meaningful tables, like ad spend by channel, daily conversions, or cost per lead. This is the transformation step in the ELT flow.
Good transformation also includes data quality checks. You’ll filter out bad entries, fix inconsistent formats, and ensure everything is complete. This step makes your metrics accurate, reusable, and ready for dashboards. It also allows for consistent reporting across clients, teams, or marketing channels.
Data Visualization and Analytics
Once your data is cleaned and modeled, it’s time to turn numbers into insights. Tools like Looker Studio or Google Sheets help you build visual dashboards, reports, and summaries using your transformed data. These tools are simple, flexible, and widely used by both technical and non-technical teams.
Visualization is where data becomes actionable. You can track trends, compare campaigns, and identify what’s working or not at a glance. When everyone can understand the numbers easily, better decisions follow. It’s not just about charts, it’s about seeing what matters, quickly and clearly.
Data Governance and Monitoring
Even a free stack needs visibility and control. This final layer ensures your analytics setup runs reliably and securely as it scales. With OWOX, you can log every pipeline run, trace errors, and manage credentials inside your own environment, without exposing data to external systems.
Governance also means monitoring performance, validating data quality, and staying compliant with privacy rules. As your reporting expands, a strong governance layer keeps your stack trustworthy, so teams can act on data with confidence.
Step-by-Step: Build Your Free Data Stack with JavaScript, SQL, BigQuery & OWOX
Paying monthly just to get your data in one place? There’s a better way. With BigQuery’s free tier, JavaScript-powered connectors, and the open-source OWOX Community Edition, you can build a complete analytics stack without expensive SaaS tools or CSV chaos. Here’s how to do it:
Step 1: Install OWOX Community Edition with No-Code Setup
To run OWOX Data Marts locally, you need Node.js and the OWOX CLI. With this setup, you can launch a local server and use the Community Edition seamlessly.
Start by installing the latest LTS version of Node.js from nodejs.org, preferably with nvm or nvm-windows to avoid permission issues. After Node.js is ready, install the OWOX CLI globally and start the server with owox serve.
For full setup details or troubleshooting, refer to the official documentation.
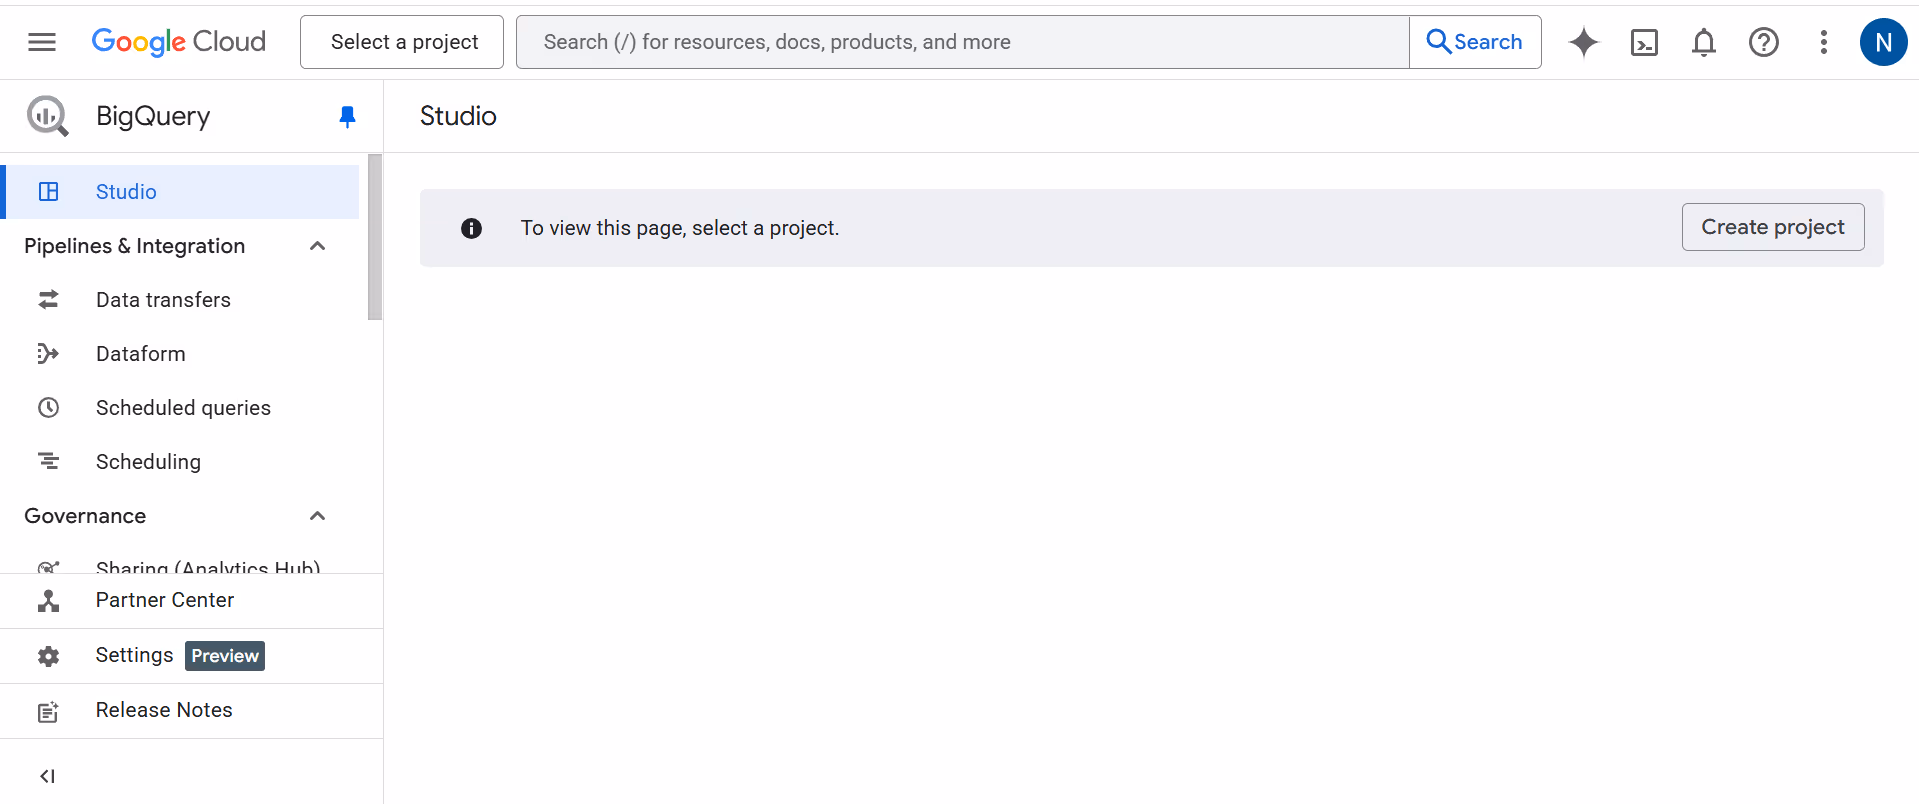
Step 2: Enable BigQuery (Free Tier)
To get started, log into the Google Cloud Console, create a new project, and enable BigQuery. If you’re on the free tier, you’ll get 10 GB of storage and 1 TB of query processing each month, more than enough for solo analysts or small teams exploring automated reporting.
Step 3: Add Connector and SQL Definitions to Your Data Mart
With BigQuery ready, the next step is to define how your data flows in and how it’s modeled for reporting. OWOX Data Marts uses two types of definitions: Connector Definitions for data ingestion and SQL Definitions for data transformation. Together, they turn raw platform data into structured, analysis-ready outputs.
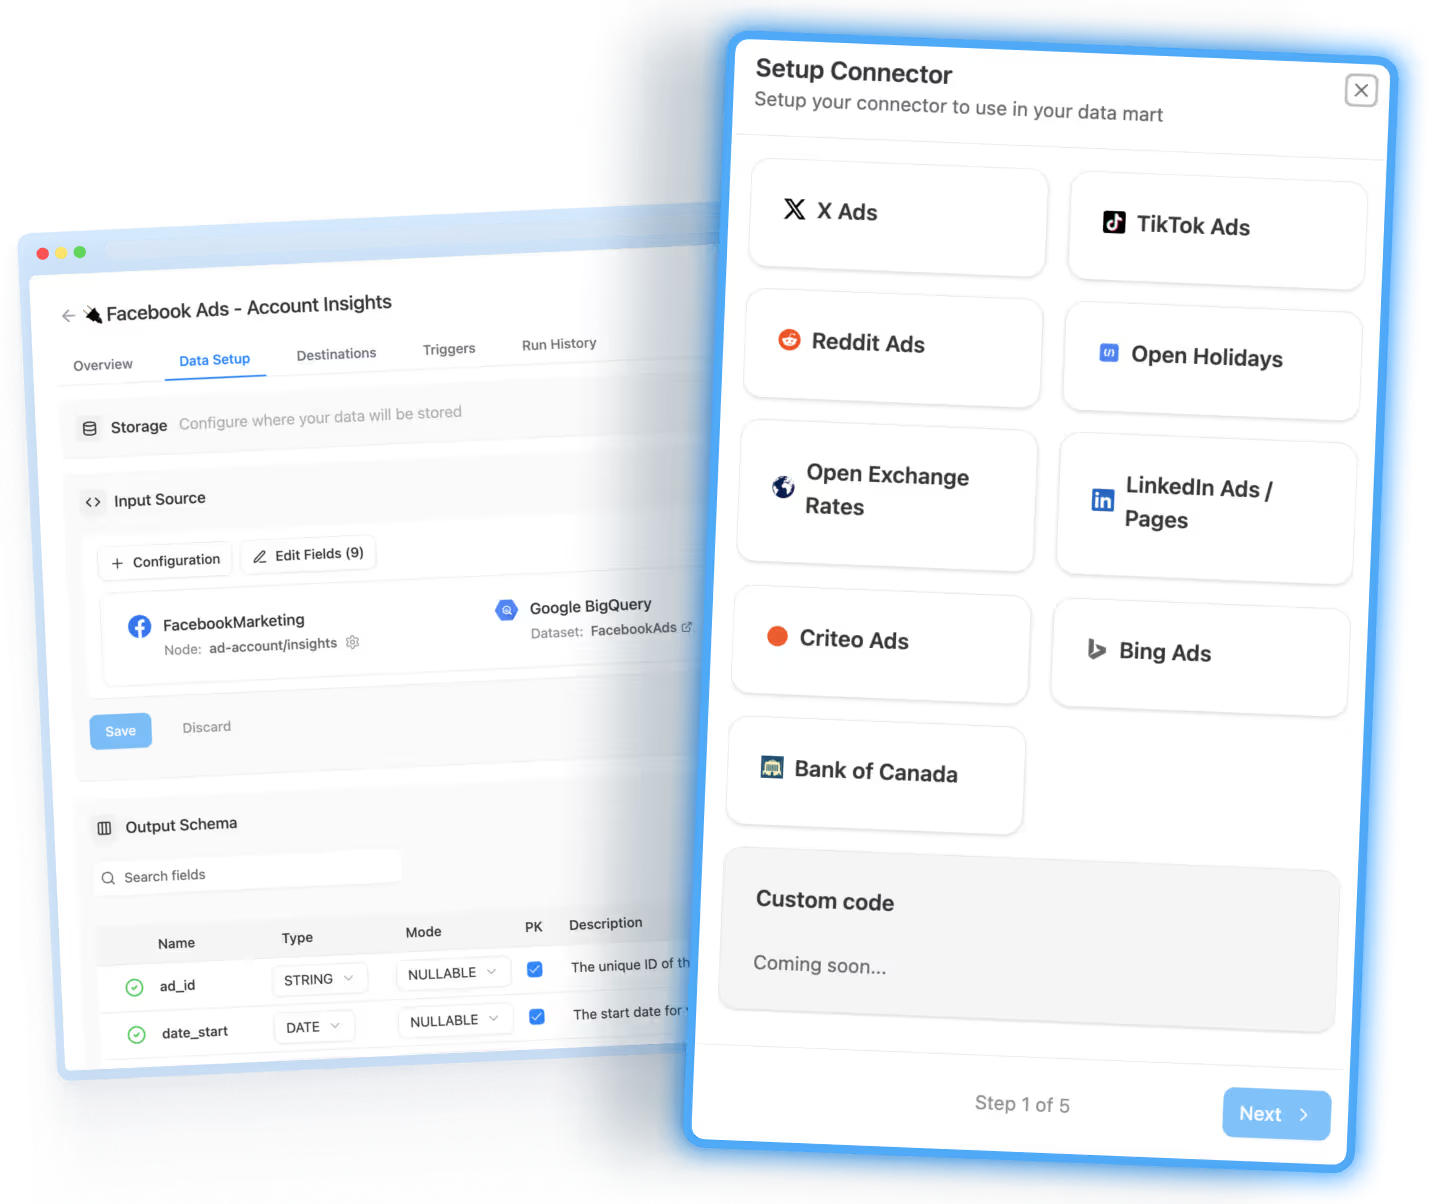
Connector Definitions (Ingest Data into BigQuery):

- Pick a connector for your source platform, such as Facebook Ads, TikTok, or LinkedIn.
- Configure required parameters like API credentials, date ranges, and metrics.
- Data is then sent directly into your BigQuery dataset, without CSVs or third-party SaaS.
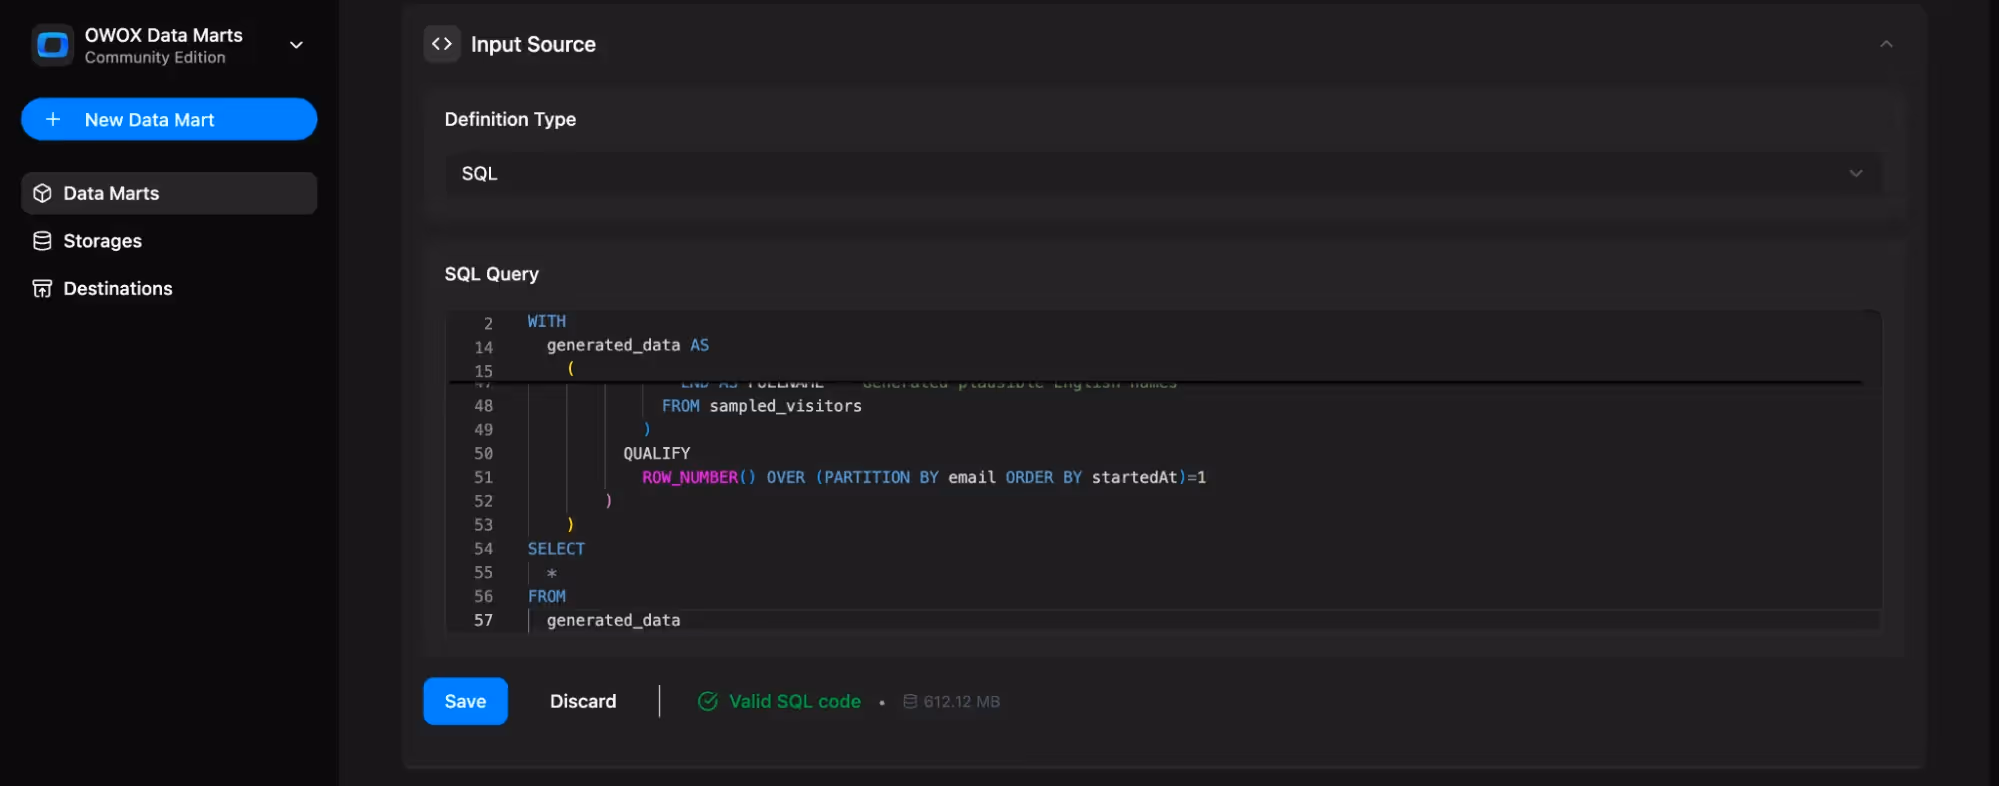
SQL Definitions (Transform Data into Reports):
- Start by creating a new data mart and choosing the definition type as SQL. This tells OWOX Data Marts that the transformation logic will be based on custom SQL queries.
- Use SQL to filter out invalid rows, join related tables (such as campaigns with conversions), calculate key metrics like ROAS or CPA, and standardize dimensions across platforms. This query operates on the raw data already loaded into BigQuery via the Connector Definition in the previous step.
- You can assign human-readable aliases and descriptions to complex fields (e.g., campaign_id as Campaign ID, total_spend as Ad Spend) to create a semantic layer that’s easy to use across tools like Sheets or Looker Studio.
By combining connector and SQL definitions, you build a full data pipeline: ad platforms feed data into BigQuery, and SQL definitions turn that data into the metrics your team needs in Sheets or dashboards.
Check out the official docs to walk through each step in detail.
Step 4: Visualize in Google Sheets and Looker Studio
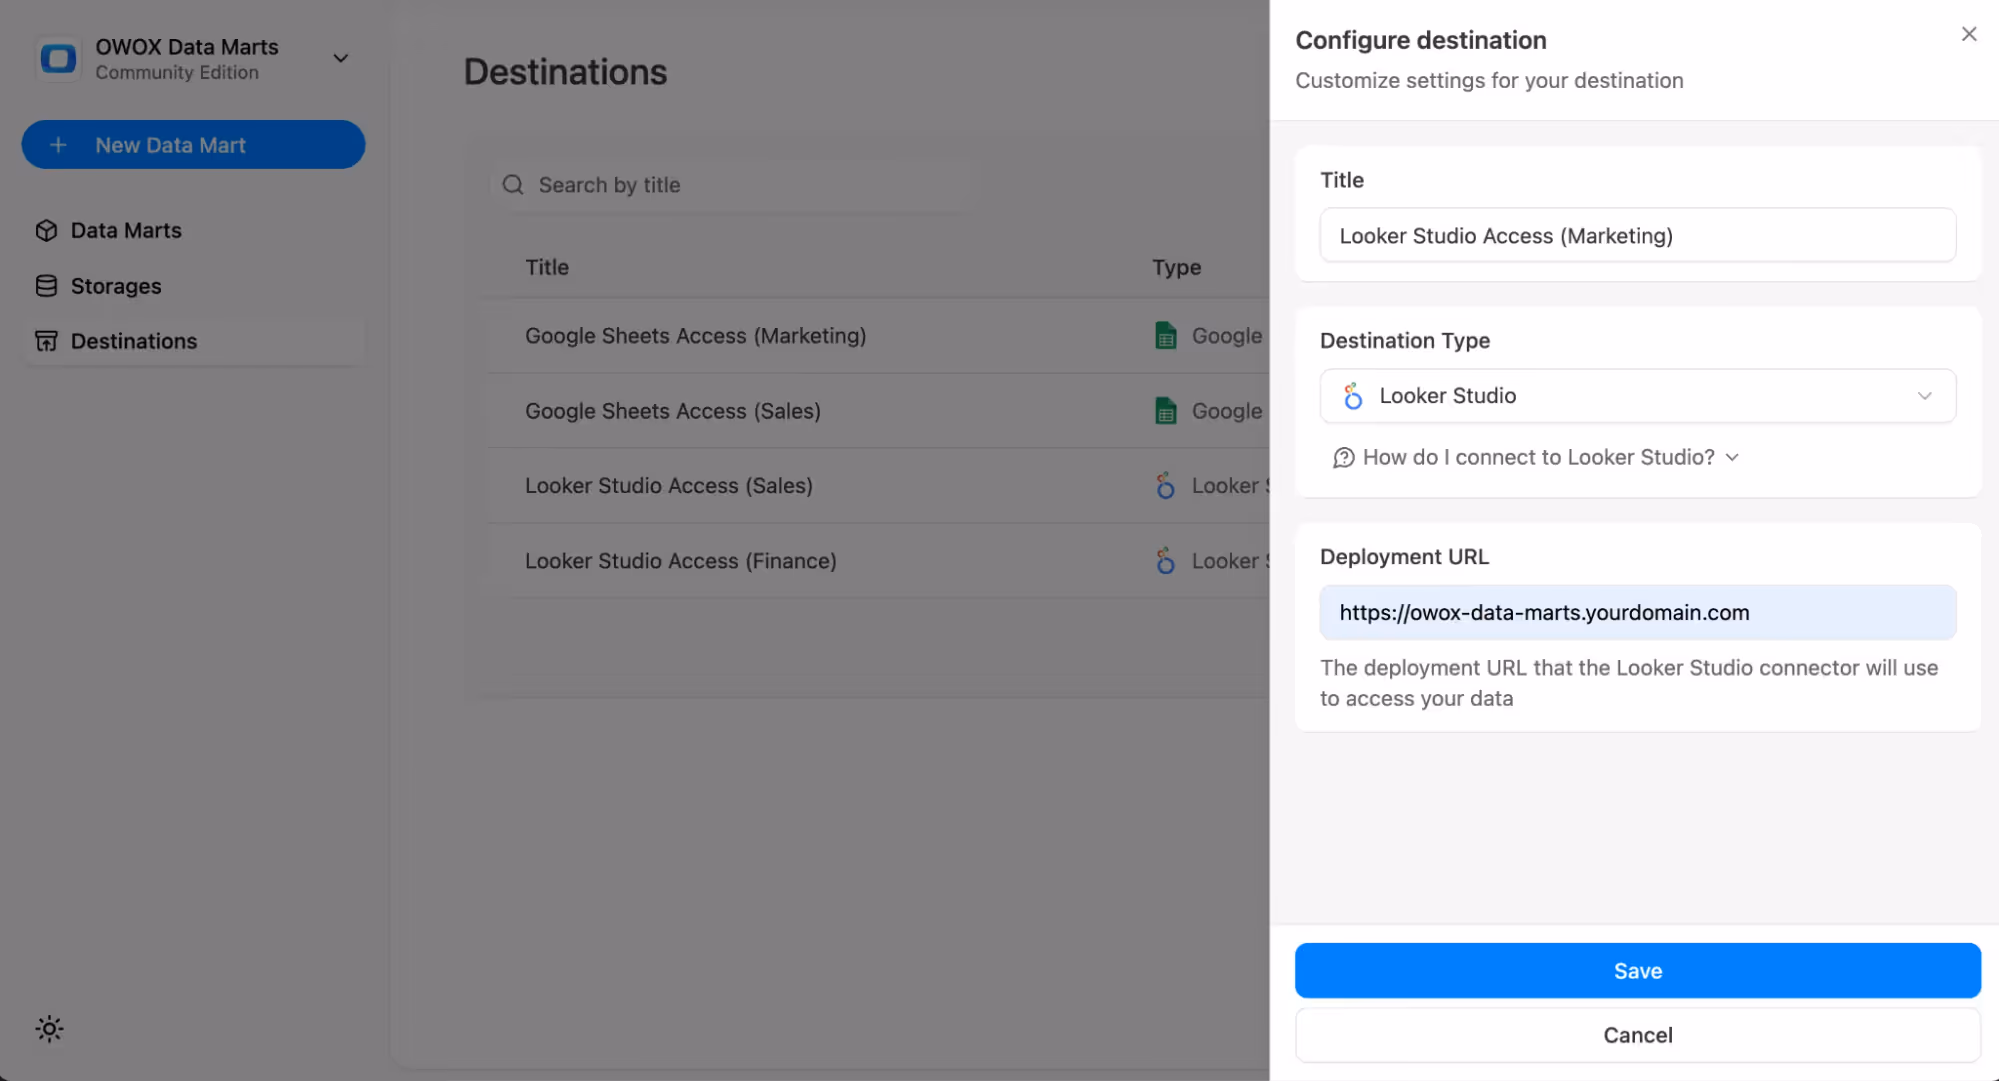
Destinations are the interfaces or applications where business users access the results of their Data Marts.
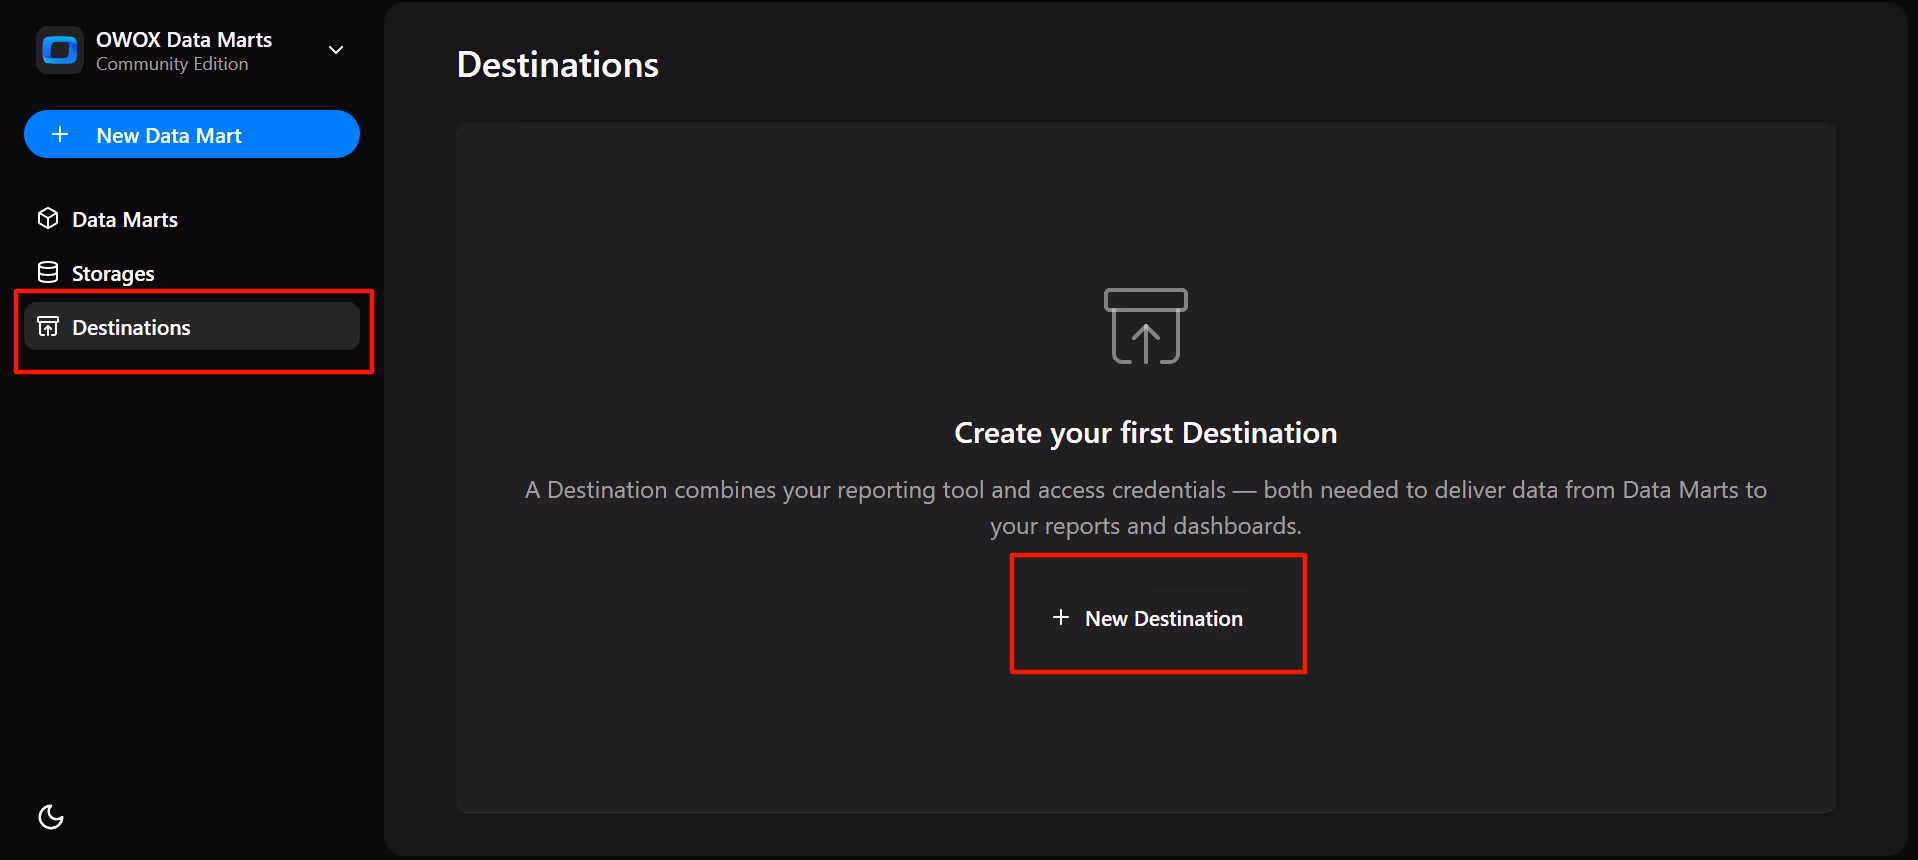
To set up a new destination, go to the Destinations page and click + New Destination. From the Destination Type dropdown, select the storage type you need:
Once selected, fill out the configuration fields required for that destination type (e.g., JSON key for Sheets, Deployment URL for Looker Studio). When finished, click Save to apply the configuration or Cancel to discard changes.
To connect your Data Mart to a Destination, open the Data Mart and go to the Destinations tab. All configured destinations, whether Google Sheets or Looker Studio, will be listed there.
For Google Sheets
You can connect your marts to Google Sheets to make pivot tables, charts, or shared reports.
- Choose the Google Sheets Destination created and click on “Add Report” for data to be uploaded to your desired Google Sheet.
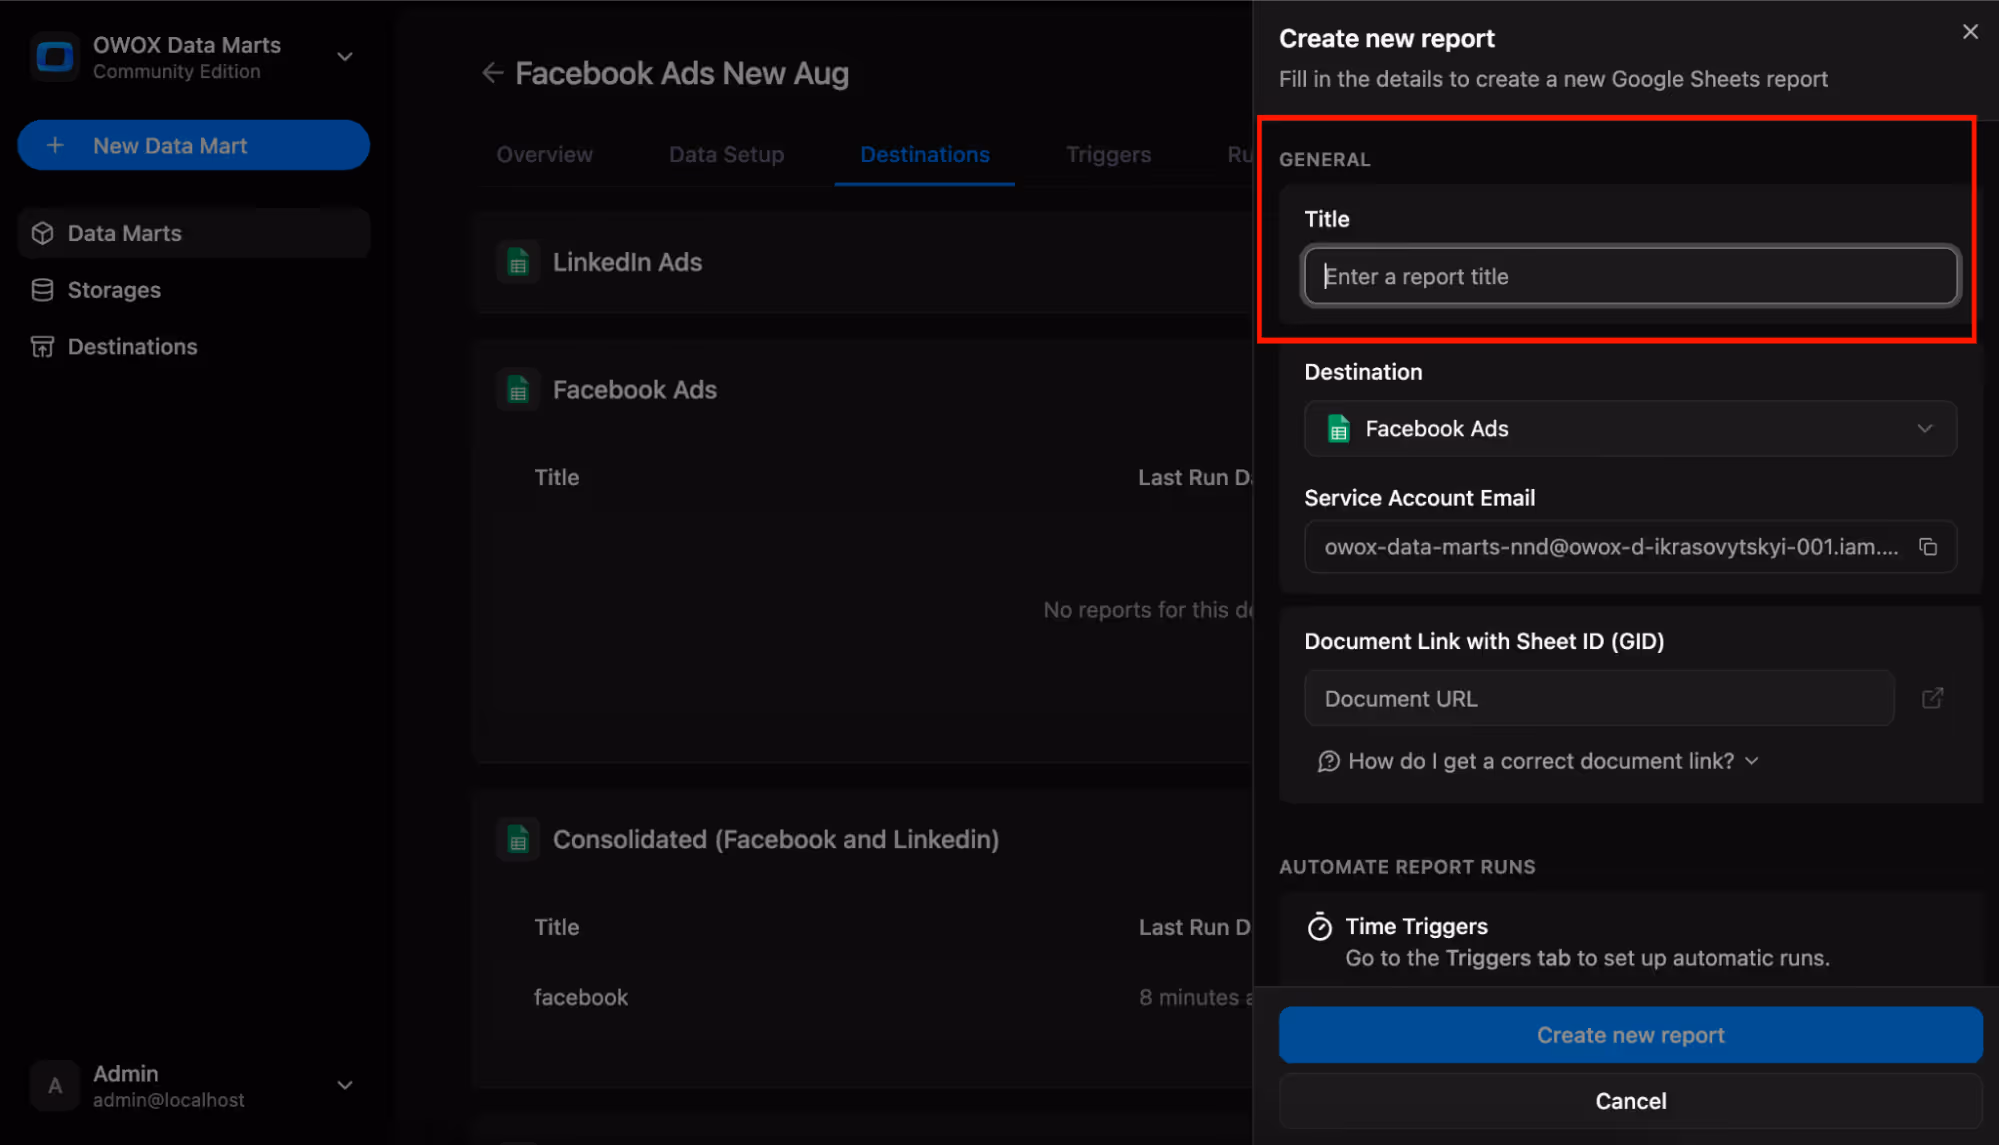
- Copy the Service Account email from the Report Configuration Panel and grant it “Editor” access to the target Google Sheet.
- Copy the Google Sheet link (with the GID parameter from the URL bar) and paste it back into the OWOX Data Mart Report Configuration Panel.
- Click Create new report button.
- Your BigQuery data will now flow automatically into the connected Sheet.
For Looker Studio
You can also deliver marts to Looker Studio for interactive dashboards.
- Go to the Destinations tab inside the Data Mart. Ensure that Looker Studio is connected to the Data Mart.
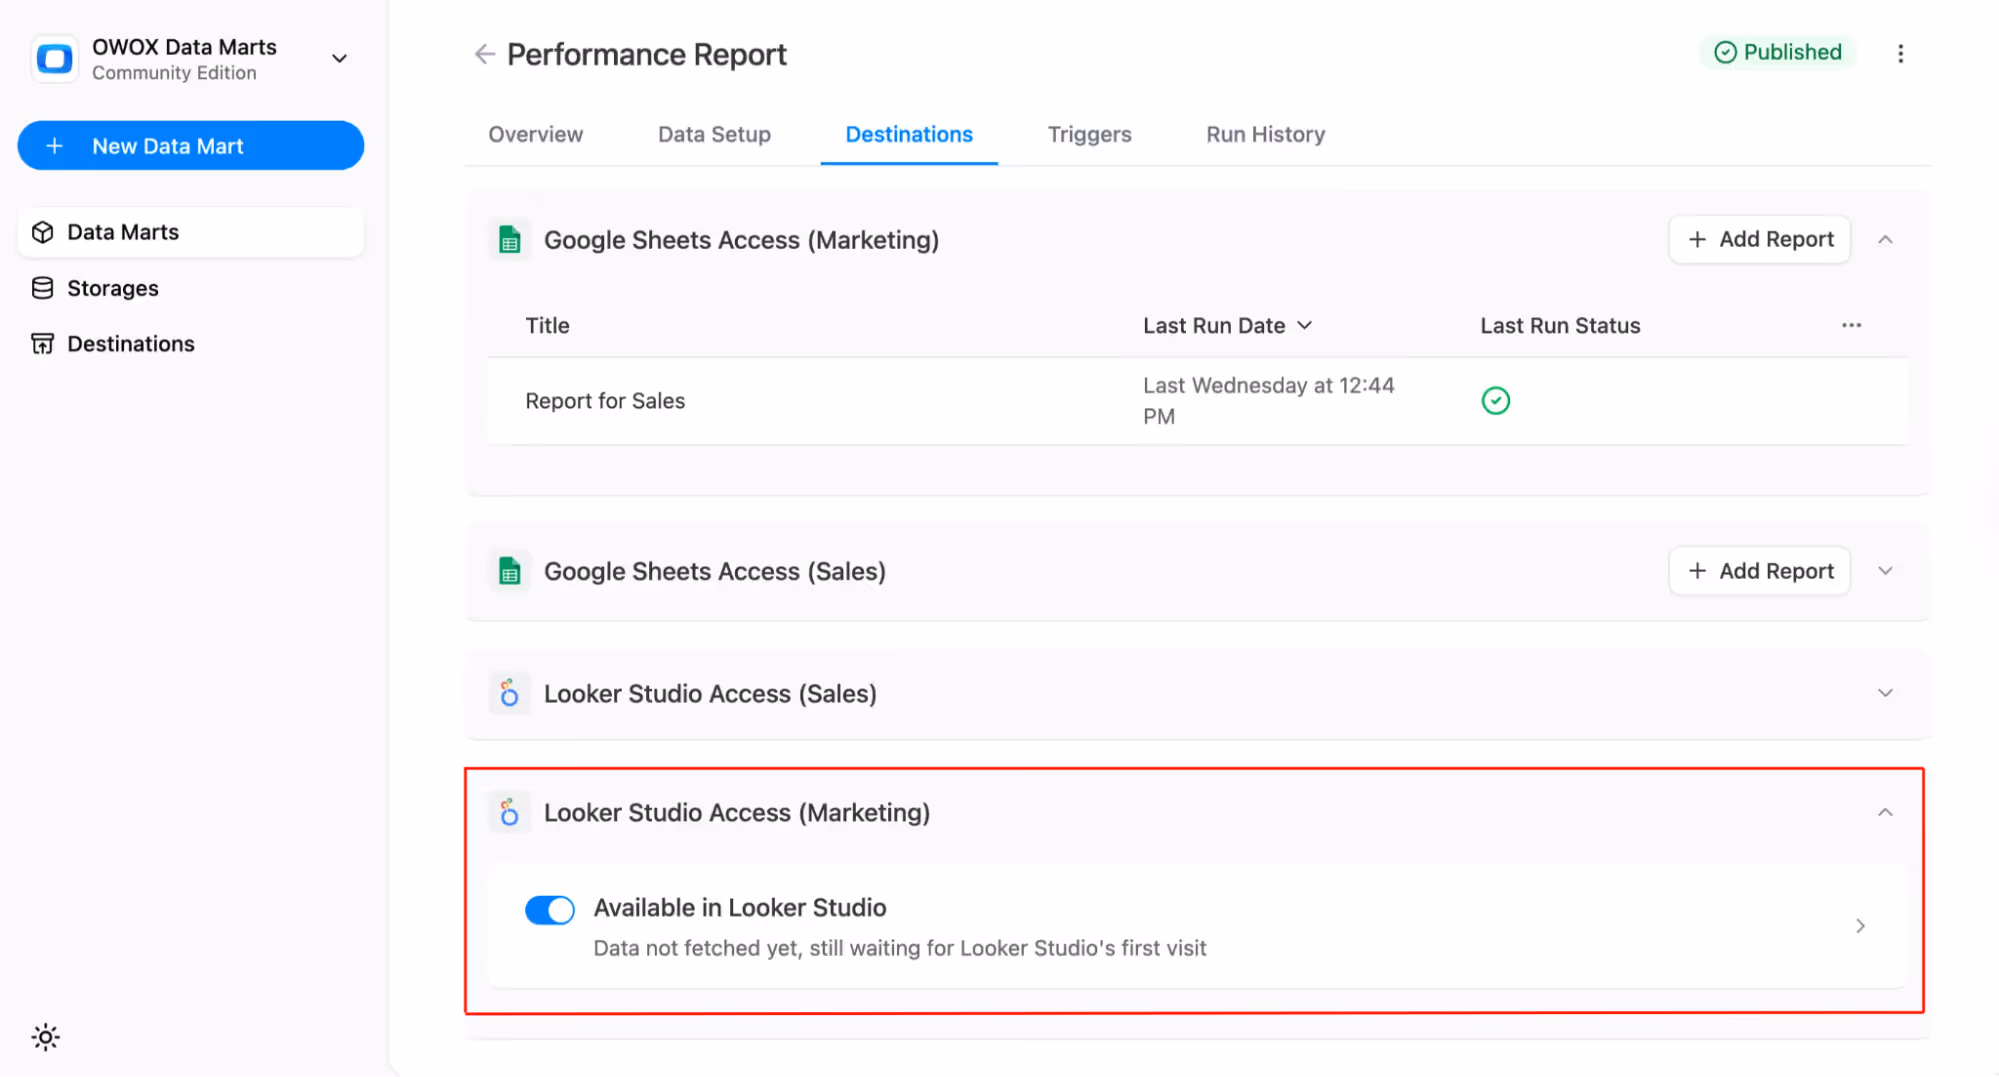
- Once the destination is created in OWOX Data Marts, follow these steps inside Looker Studio:
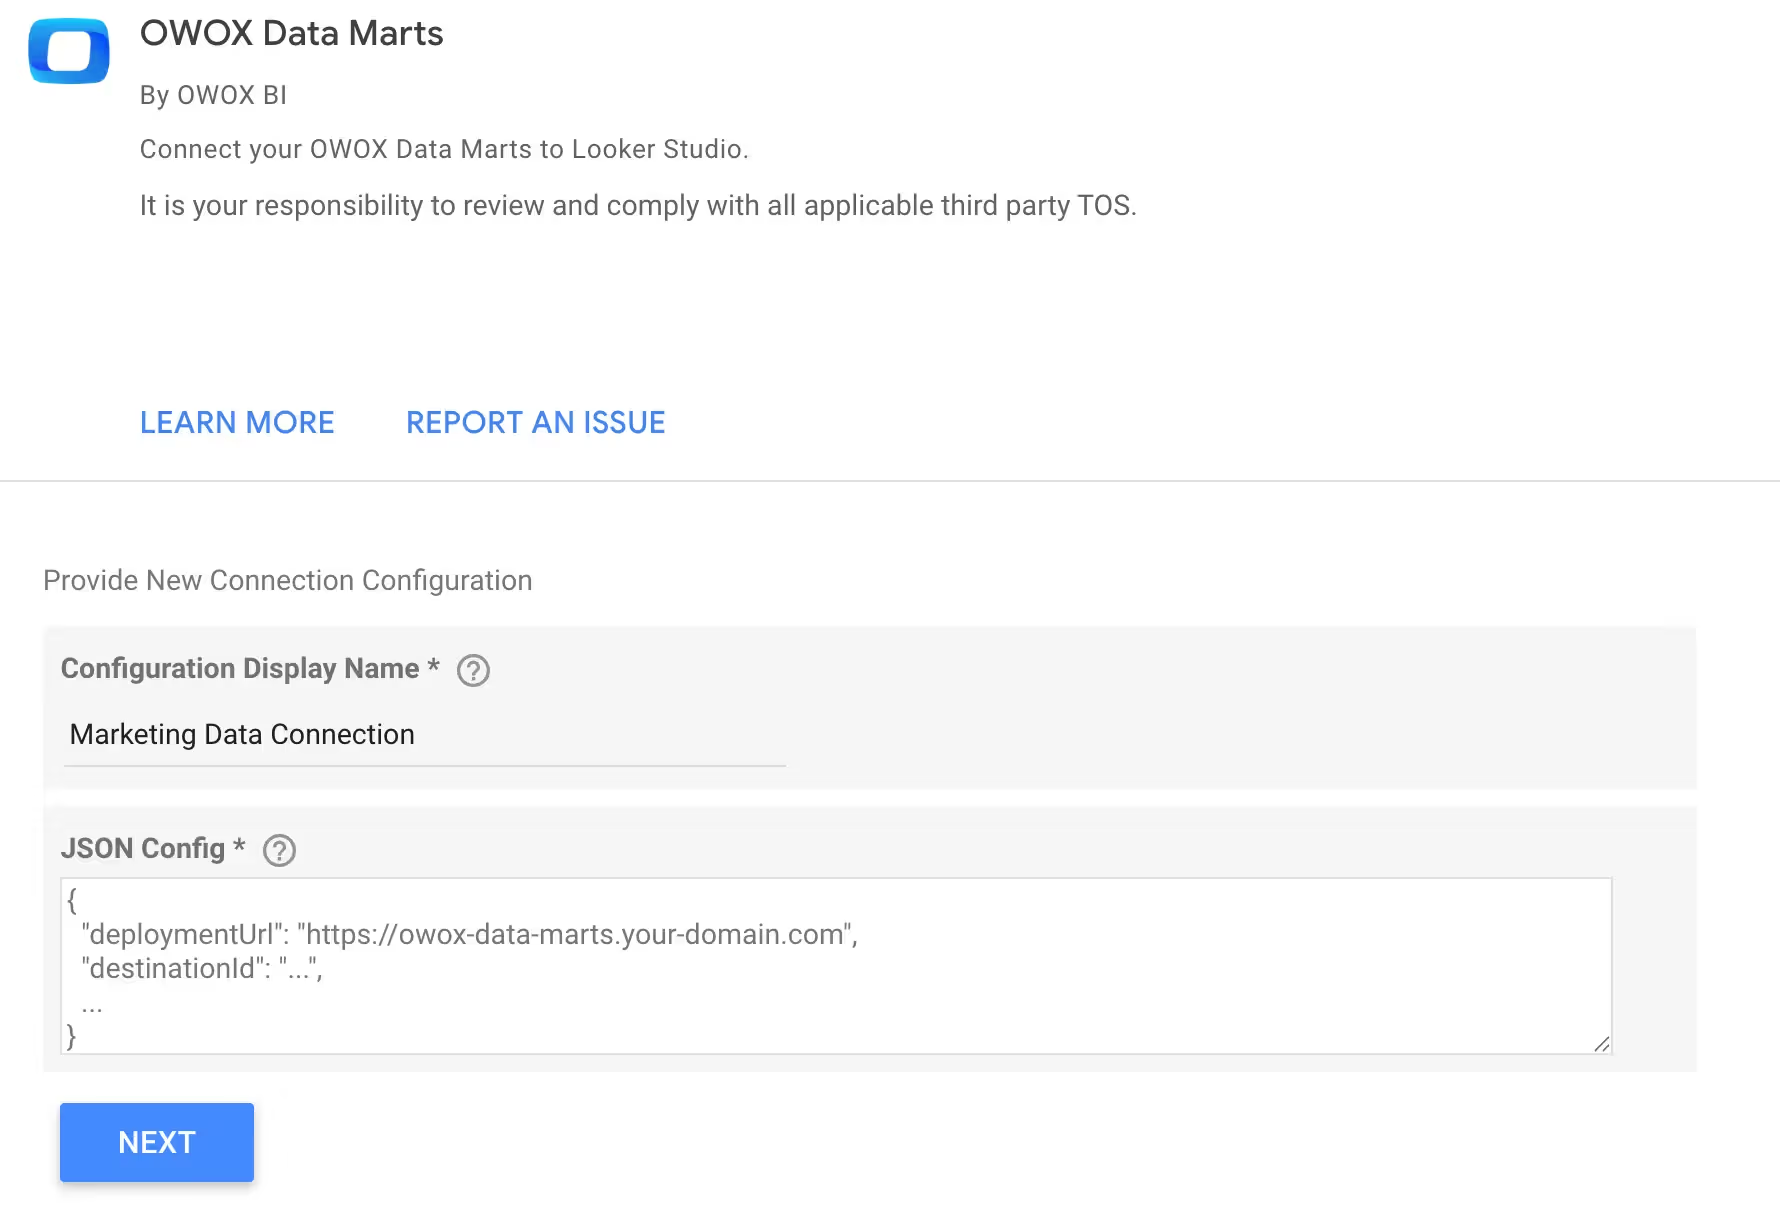
- Search for OWOX Data Marts in the Looker Studio connector gallery and authorize using your Google Account, then enter a Configuration Display Name to label the connection
- Now paste the JSON Config you copied from OWOX and click Next
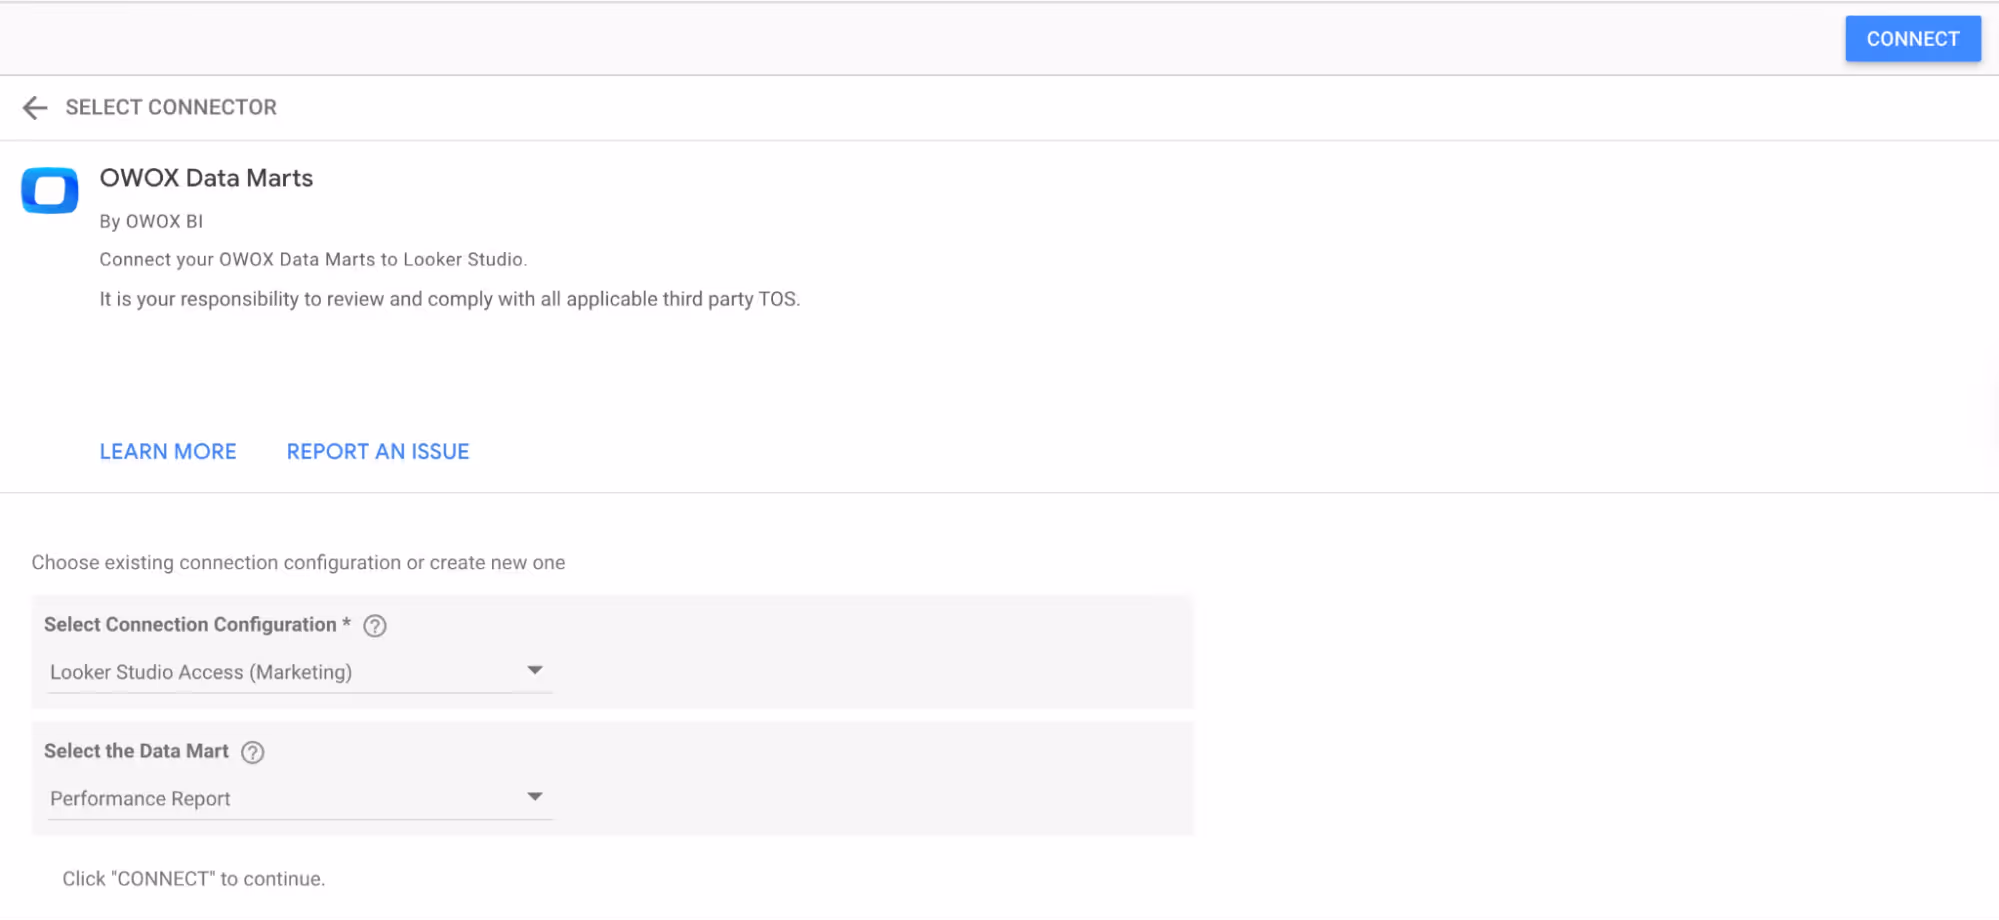
- Choose the Connection Configuration and select your Data Mart and click Connect, then verify all fields are mapped correctly.
- Your BigQuery data will now flow automatically into the connected Looker Studio.
Step 5: Automate Data Refreshes with Triggers
OWOX Data Marts supports two types of triggers, Connector Trigger and Report Trigger, to keep both your data ingestion and reporting layers fully automated.
Connector Run
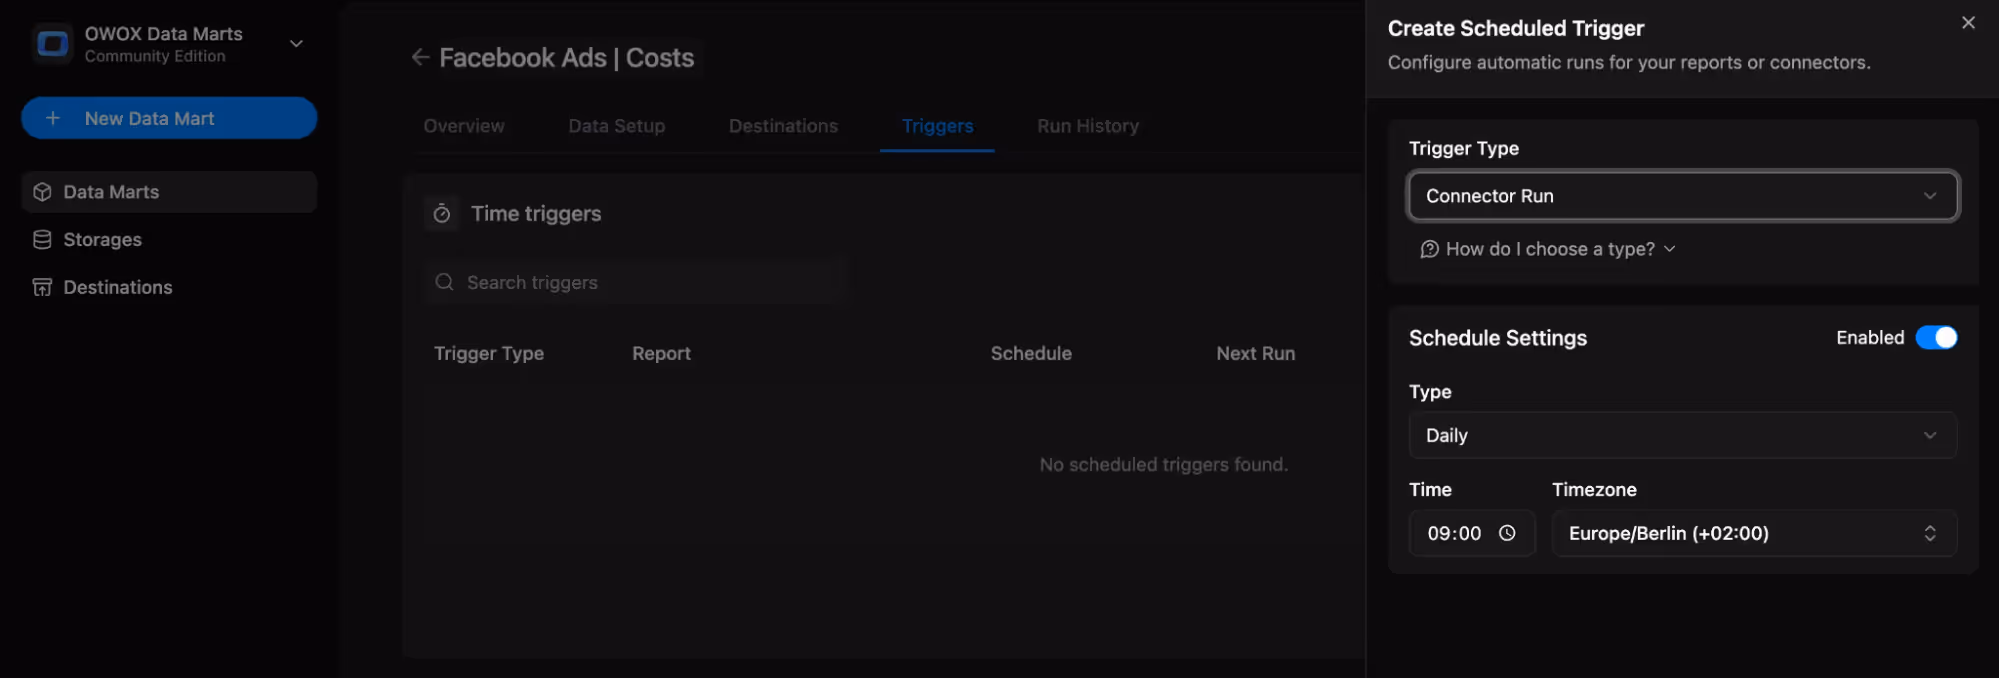
Connector triggers are used to refresh data ingestion from ad platforms into BigQuery. Once set up, they ensure your warehouse always contains the latest campaign data.
- Best for connector-based Data Marts where data must be re-imported regularly.
- Configure in the Triggers tab → Add Trigger → Connector Run.
- Choose a schedule: daily, weekly, monthly, or interval (e.g., every 15 minutes).
- Keeps your BigQuery tables continuously updated without manual runs.
Report Run
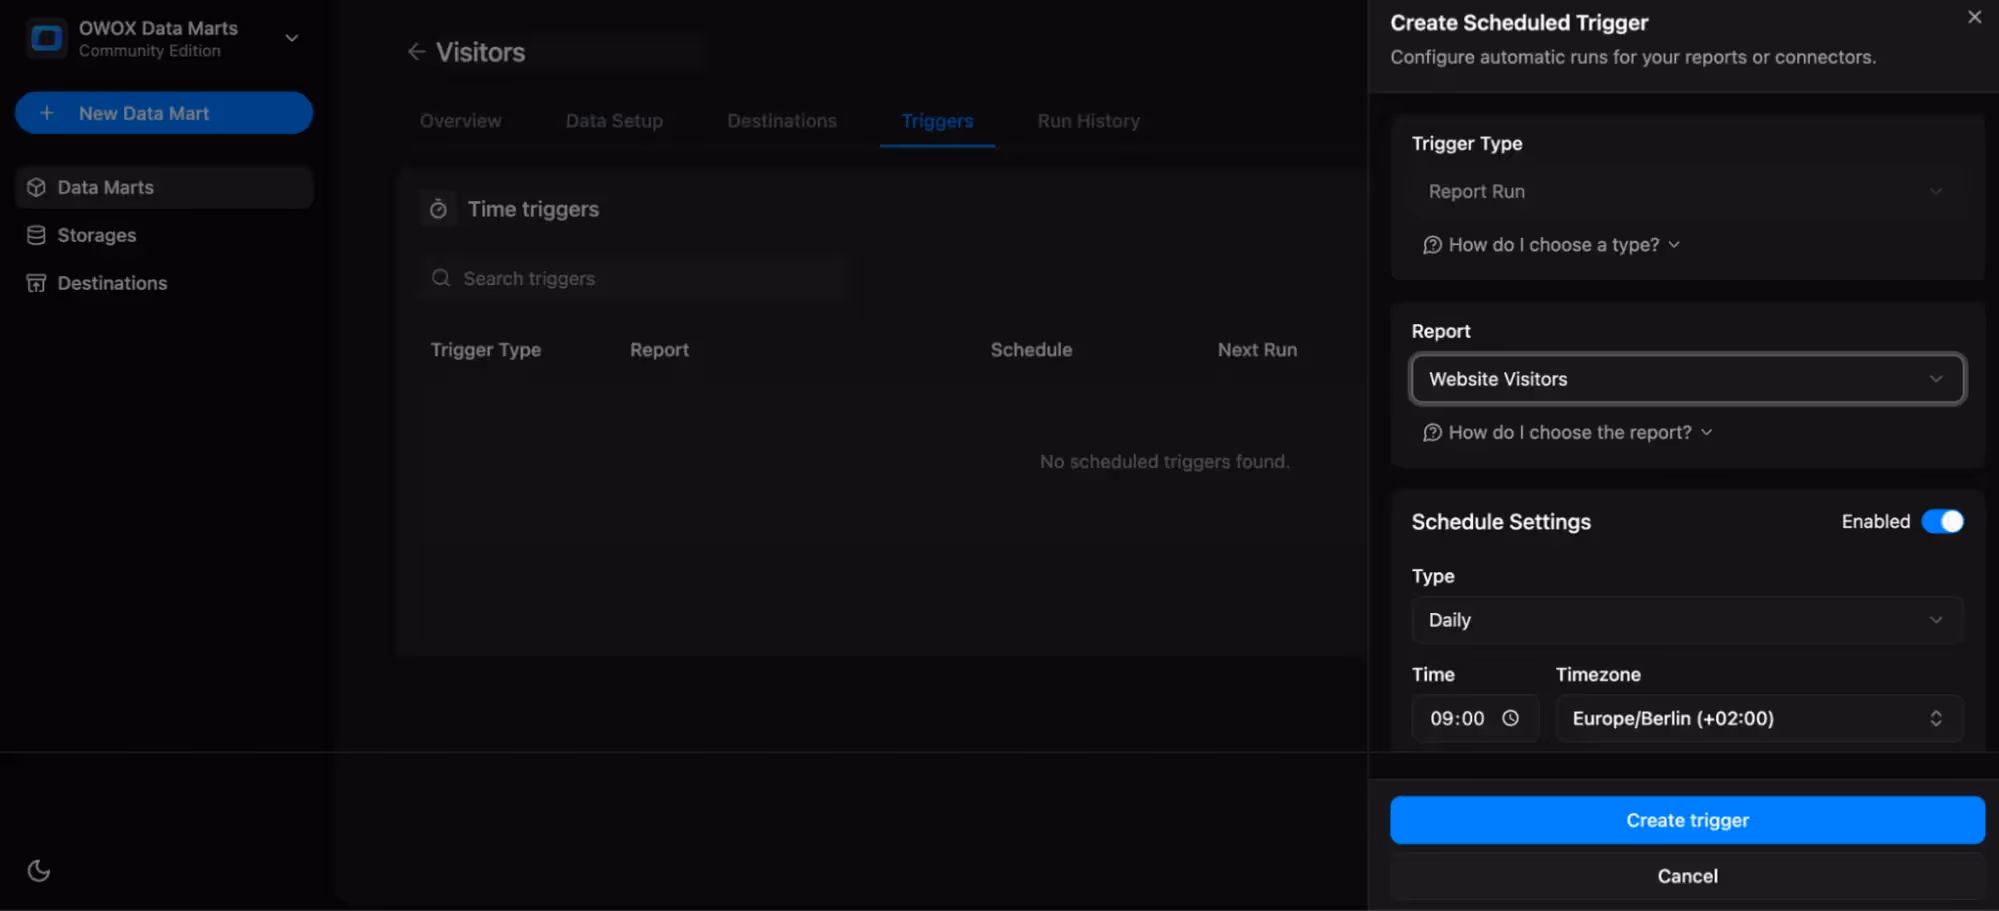
Report triggers automate SQL definitions after ingestion, transforming raw data into structured reports and pushing them to destinations like Google Sheets or Looker Studio.
- Ideal for SQL-based Data Marts that feed dashboards or reports.
- Configure in the Triggers tab → Add Trigger → Report Run.
- Define when reports should refresh, daily, weekly, monthly, or interval.
- Ensures dashboards always show current, analysis-ready metrics.
Data Stack using Free Tools vs. Using a Managed SaaS Solution
Choosing between free tools and SaaS platforms depends on your goals, budget, and control needs. Before we walk through building your free stack, it’s worth seeing how this approach compares to traditional SaaS tools.
Cost Structure – Free Tier vs Subscription Fees
A self-hosted stack built with BigQuery’s free tier and OWOX’s open-source tools allows you to run analytics at almost zero cost. BigQuery gives you 10 GB of storage and 1 TB of monthly query processing for free, which is enough for many small teams or solo analysts. There are no extra charges for adding users or connecting new data sources within this setup.
In contrast, SaaS tools like Supermetrics and Funnel use subscription models that charge you per data source, per user, or based on data volume. As your reporting needs grow, so do your bills. For agencies or multi-brand teams, these costs can add up quickly and become hard to justify.

Flexibility and Custom Control vs Turnkey Convenience
With open-source tools like OWOX, you have full control over your pipeline, from the way data is pulled to how it’s transformed and visualized. You can write your own SQL, adjust logic to fit business needs, and modify dashboards to meet client-specific reporting formats.
On the other hand, SaaS platforms offer plug-and-play convenience. Tools like Supermetrics offer ready-made connectors and templates that are quick to set up, but give you limited control to make changes. If flexibility is a priority, open tools give you more freedom, but if ease is key, SaaS may feel more comfortable.
Technical Skills Required – DIY Setup vs Minimal Overhead
Setting up a self-hosted stack with OWOX and BigQuery involves some technical knowledge. You’ll need to deploy scripts, write SQL for data modeling, and manage things like API limits or data freshness. This works best for BI engineers or analysts comfortable with databases and data flows.
SaaS platforms are built to be low-code or no-code. They offer guided onboarding, visual interfaces, and automation that make setup quick and beginner-friendly. For non-technical marketers or smaller teams without a developer, this makes SaaS tools easier to adopt, though at the cost of some control and customization.
Self-Managed Security vs Vendor-Controlled Compliance

Using open-source tools means everything stays within your infrastructure. You control where data is stored, how long it’s kept, and who has access. This setup supports better compliance, full audit trails, and tighter access policies, which are important for teams handling sensitive or regulated data.
In SaaS platforms, your data is routed through the vendor’s servers. They handle encryption, monitoring, and basic compliance features, but the data lives on their infrastructure. While this reduces setup work, it limits your visibility and may expose you to risks if their security practices don’t align with your internal policies.
Scale Clients Freely vs Per-Client Licensing Fees
Open tools like OWOX and BigQuery let you add new clients or projects without worrying about extra licenses. Whether you're building dashboards for one brand or ten, your only cost is tied to data volume or queries, not users or accounts.
But SaaS tools usually charge based on seats, users, or the number of connected accounts. For agencies or consultants managing multiple clients, this can make scaling expensive. Each new dashboard, data source, or user might require a separate fee, making it harder to maintain a predictable budget as your workload increases.
Community Connectors vs. Vendor-Maintained Integrations
OWOX and other open-source tools offer connectors built by the community. These are flexible and free to modify, letting you adapt the setup to your exact needs.
Vendor-managed integrations in SaaS tools are professionally supported and easier to get started with. You don’t have to worry about maintenance, but you're limited by what the vendor provides. If a platform isn’t supported or custom logic is needed, you may have to wait for updates or rely on workarounds.
Comparison Table:
Build Your Own Data Mart Library Free with OWOX Data Marts (Community Edition) for Analysts
Managing ad data doesn’t have to mean high costs or rigid SaaS tools. With OWOX Data Marts (Community Edition), you can:
- Deploy free, no-code connectors for Facebook, LinkedIn, TikTok, and more
- Send data directly into BigQuery without vendor restrictions or subscription fees
- Adjust schemas, metrics, and refresh schedules to suit your reporting needs
- Start with one connector and expand as your data requirements grow
Check out the open-source library on GitHub and take full control of your data.
FAQ

%202.png)


.png)


