How to Collect LinkedIn Ads Data into Snowflake
Learn how to move LinkedIn Ads data into Snowflake, build governed data marts, and unlock reliable B2B ROI and performance analytics at scale.


B2B teams rely on LinkedIn for high-intent demand and pipeline, but turning LinkedIn Ads performance into reliable ROI reporting is rarely straightforward. Native exports and one-off spreadsheets break as soon as you need consistent definitions, multi-touch context, and revenue validation across campaigns, regions, and funnel stages.
.png)
This guide shows how to send LinkedIn Ads data into Snowflake using OWOX Data Marts and shape it into governed, reusable data marts built for B2B analytics. Instead of relying on ad-hoc exports or brittle scripts, you’ll create a scalable workflow that supports trusted self-service reporting and consistent insights across teams and tools.
By the end of this guide, you will have and automated LinkedIn Ads → Snowflake pipeline that continuously syncs LinkedIn Ads performance data into your Snowflake environment using OWOX Data Marts.
Plus, you’ll have a scalable foundation for Multi-Channel B2B ROI Analytics – a structured approach you can extend to other paid channels while preserving unified metric definitions and attribution logic.
Why Move LinkedIn Ads Data into Snowflake for B2B Analytics?
LinkedIn Ads reporting works well for channel-level optimization, but limitations appear when B2B teams need to connect ad performance to pipeline, opportunities, and revenue across systems.
Common challenges:
- Fragmented data between LinkedIn, CRM, product, and finance systems
- Manual CSV exports and spreadsheet-based joins
- Inconsistent KPI definitions across marketing, sales, and finance
- Limited visibility into full-funnel and multi-touch attribution
- Reporting delays caused by brittle scripts or ad-hoc workflows
Moving LinkedIn Ads data into Snowflake enables:
- Centralized storage alongside CRM, opportunity, and revenue data
- Scalable SQL data manipulations for granular campaign and funnel analysis
- Consistent KPI definitions for CPL, cost per SQL, cost per opportunity, and ROAS
- Full-funnel pipeline attribution from impression to closed-won revenue
- Integration with BI tools, Google Sheets, and AI-driven workflows
This approach shifts LinkedIn reporting from isolated platform dashboards to a governed, warehouse-driven B2B analytics foundation.
Why Not DIY ETL or Native LinkedIn Ads Reporting?
LinkedIn Ads reporting is built for campaign-level optimization, but limitations appear once B2B analytics expands into CRM attribution, pipeline measurement, and revenue modeling.
Common challenges include:
- Fragmented data across LinkedIn, CRM, product, and billing systems
- Manual CSV exports and spreadsheet-based joins
- Inconsistent definitions of ROI, CPL, and pipeline metrics across teams
- Limited full-funnel attribution beyond platform-reported conversions
- Reporting delays caused by brittle scripts or unmonitored API workflows
Basic API scripts or one-off connectors may move LinkedIn Ads data into Snowflake, but raw tables alone do not create trusted reporting. The real challenge is transforming campaign, creative, and conversion data into standardized, business-ready datasets that B2B teams can rely on.
Data Mart–First Approach Works Better
A structured LinkedIn Ads data mart inside Snowflake ensures:
- Standardized definitions of impressions, clicks, spend, leads, pipeline, and ROAS
- Consistent campaign and account hierarchies across regions and business units
- Clear separation between raw ingestion tables and analytics-ready views
- Governed KPI logic for CPL, cost per SQL, cost per opportunity, and revenue attribution
- Reusable reporting views for dashboards, Google Sheets, Looker Studio, and AI workflows
Instead of embedding KPI logic across multiple BI tools and spreadsheets, the LinkedIn Ads data mart centralizes definitions inside Snowflake. Dashboards, CRM reports, and AI systems all query the same modeled layer, reducing discrepancies and duplicated transformation logic while enabling reliable B2B ROI analysis.
Architecture Overview: LinkedIn Ads to Snowflake
The LinkedIn Ads to Snowflake workflow follows three distinct stages.
LinkedIn Ads Data Extraction
LinkedIn Ads campaign, creative, audience, and conversion data are retrieved through the LinkedIn Marketing API on a scheduled basis via OWOX Data Marts.
Loading Linkedin Ads Data into Snowflake
Raw LinkedIn Ads data lands in Snowflake tables that reflect the source structure, preserving full granularity across accounts, campaign groups, campaigns, ads, and daily performance metrics for validation and reconciliation.
Re-Using & Enablement
On top of raw tables, a structured LinkedIn Ads data mart is built to:
- Standardize impressions, clicks, spend, leads, and conversion metrics
- Align campaign groups, campaigns, and ad hierarchies across accounts
- Define governed KPIs such as CPL, cost per SQL, cost per opportunity, and ROAS
- Publish reporting-ready views for BI tools, Google Sheets, and AI workflows
- Enable blending with CRM and revenue tables for pipeline attribution
This layered architecture separates ingestion from modeling and modeling from consumption, creating a governed foundation for scalable B2B marketing analytics inside Snowflake.
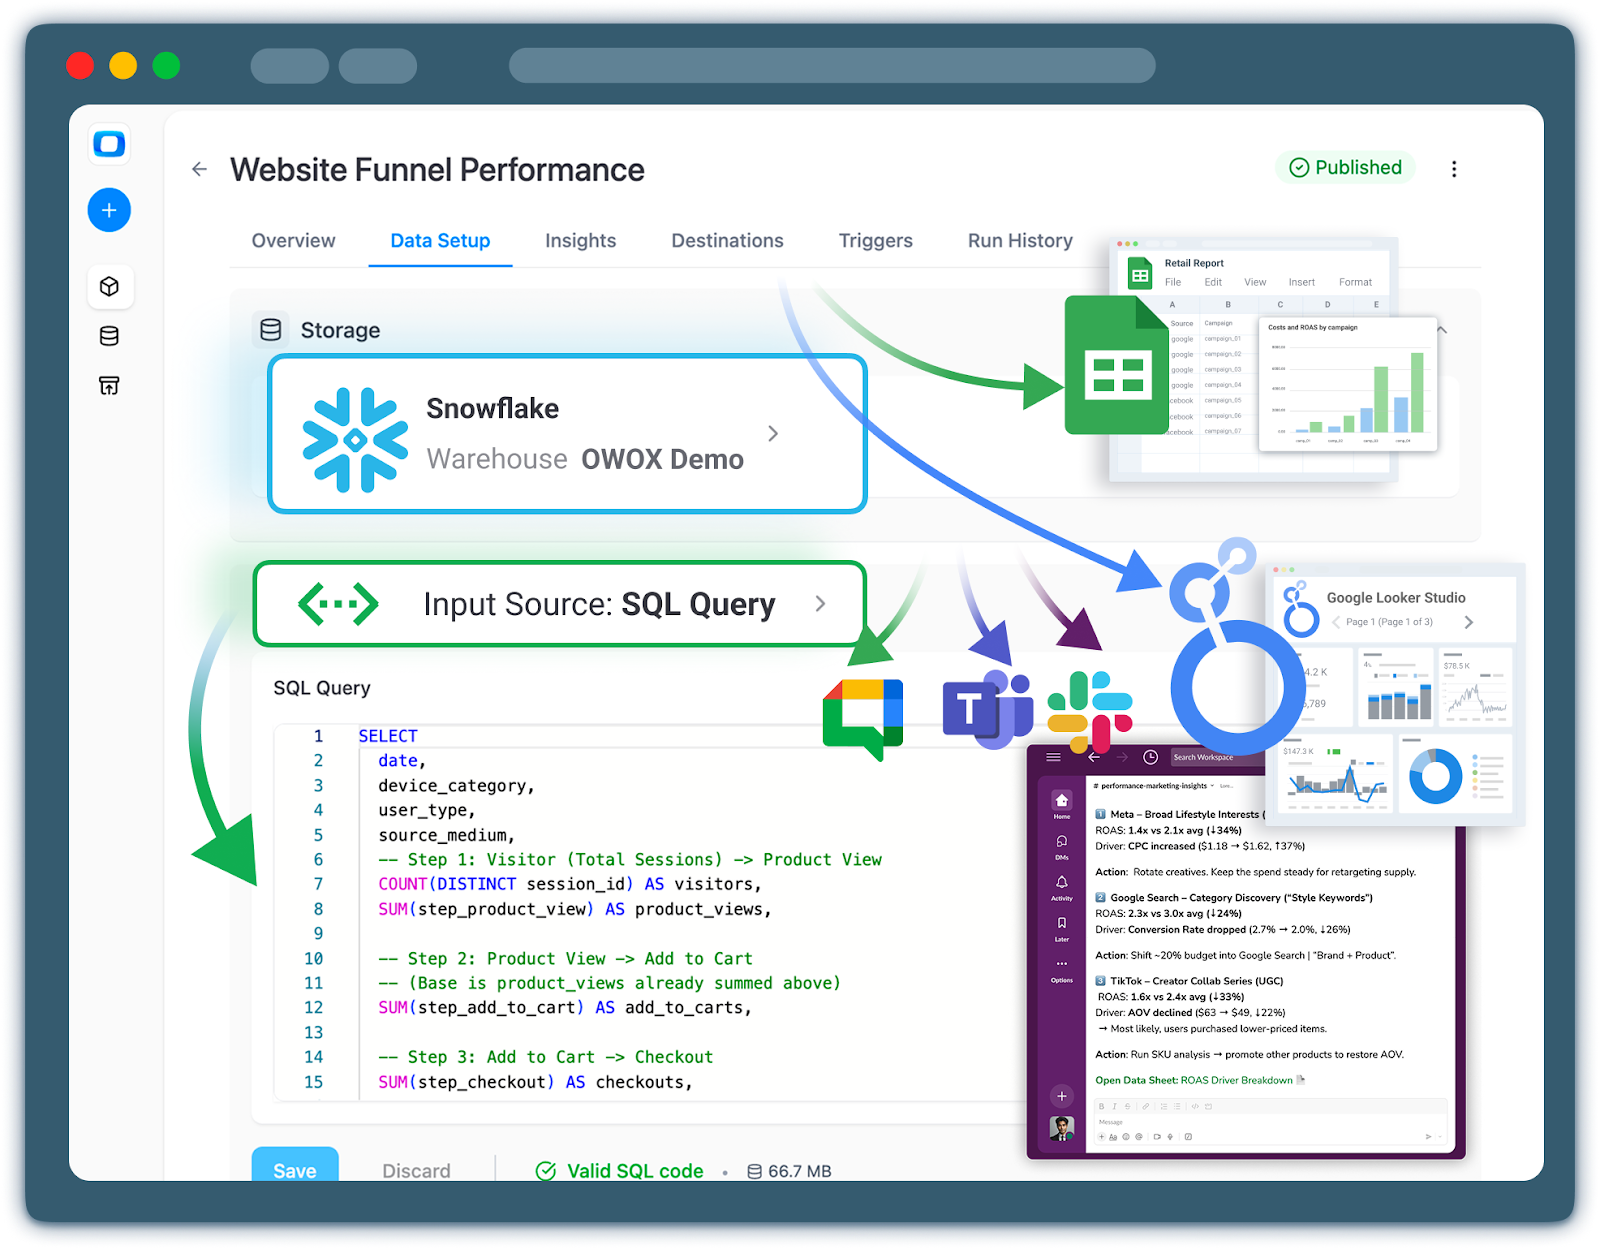
Step 1: Connect Snowflake as Your Storage in OWOX Data Marts
The first step in your LinkedIn Ads → Snowflake pipeline is to configure Snowflake as your primary storage inside OWOX Data Marts. This connection is created once and reused across all data marts, including the one that will ingest LinkedIn Ads data.
Creating a Snowflake connection in OWOX Data Marts
First, you’ll tell OWOX how to reach your Snowflake account and which credentials to use.
1. Log in to OWOX Data Marts
- Go to https://www.owox.com/app-signup
- Create a workspace if you don’t already have one.
2. Go to the data storages
- In the OWOX Data Marts interface, open the Storages section
- Then click “+ new storage”.
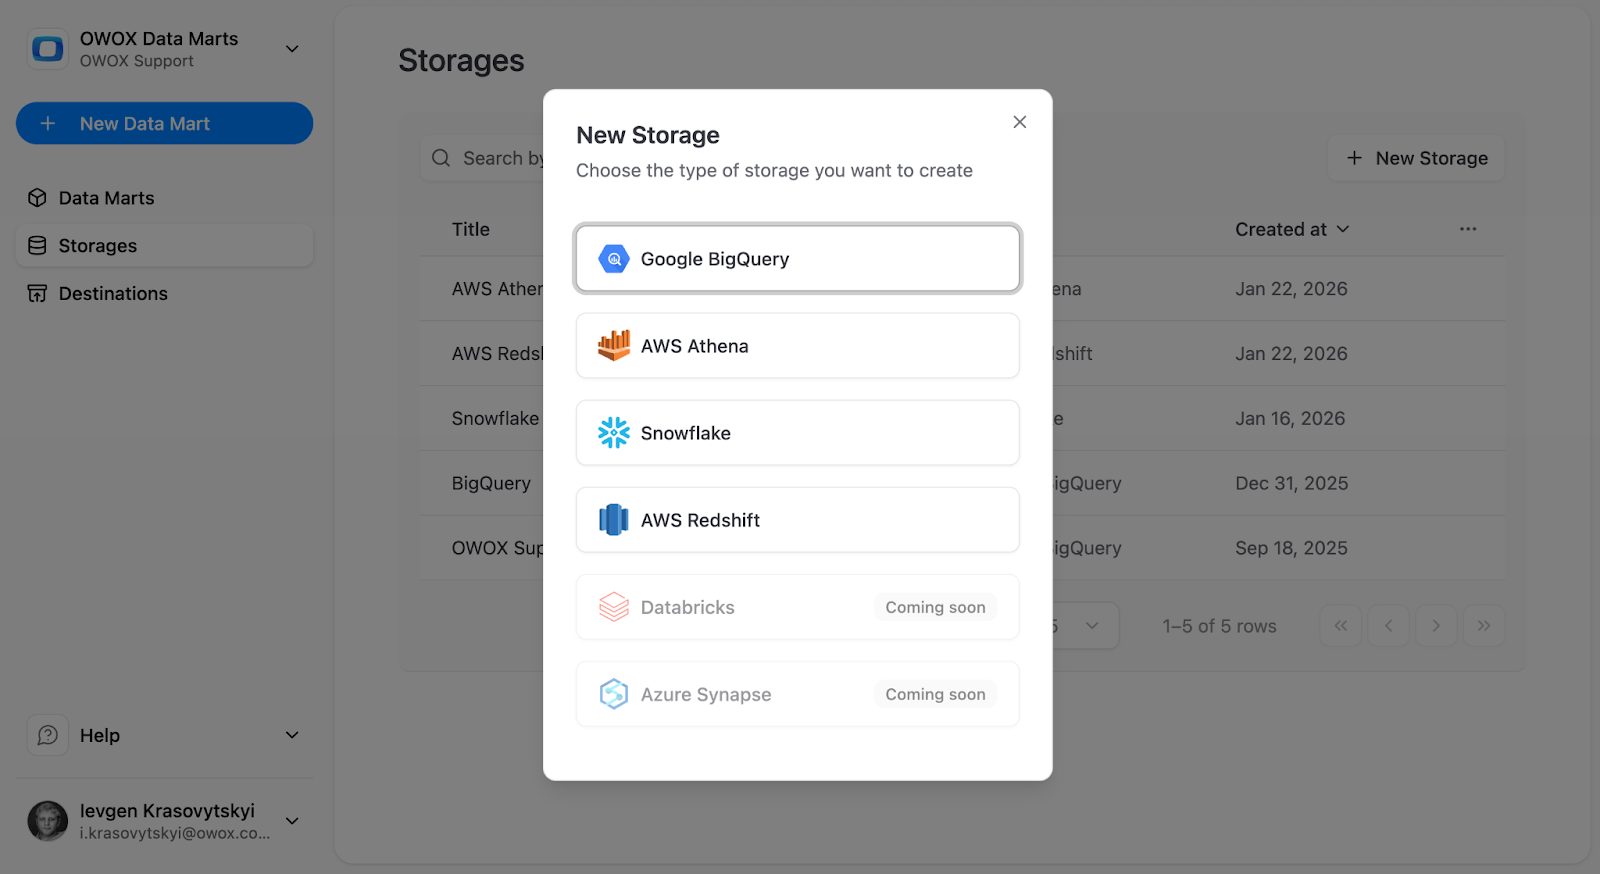
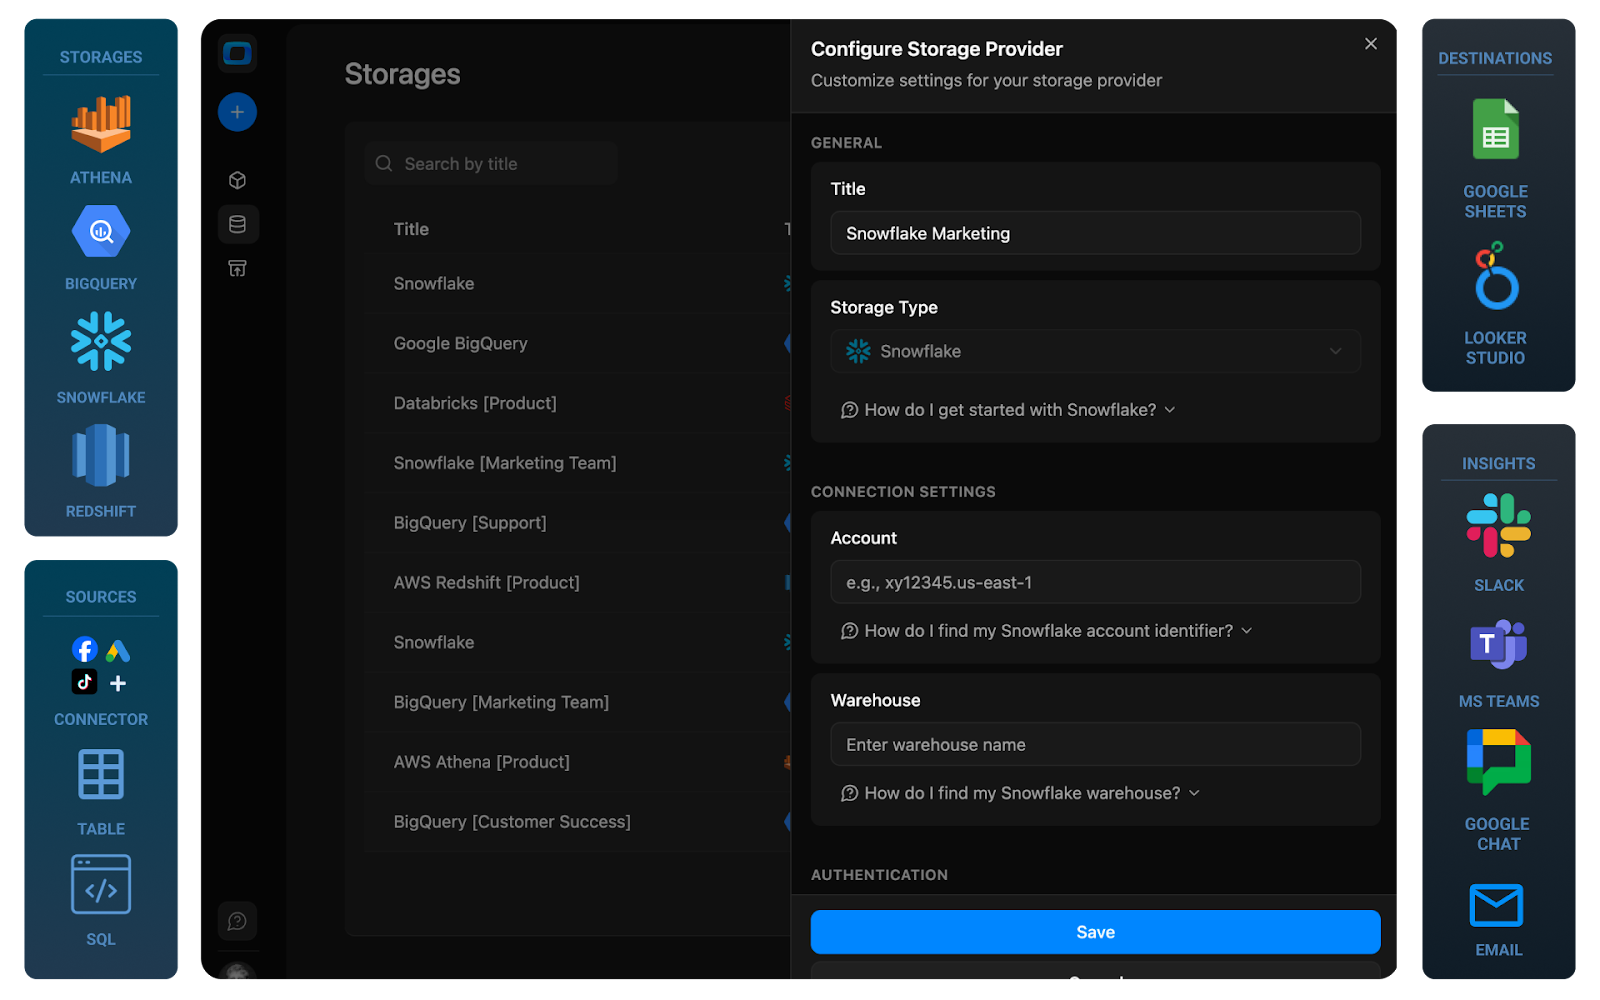
3. Select Snowflake as the storage type
- From the list of available destinations, choose Snowflake.
- This opens the Snowflake configuration form, where you’ll enter connection parameters.
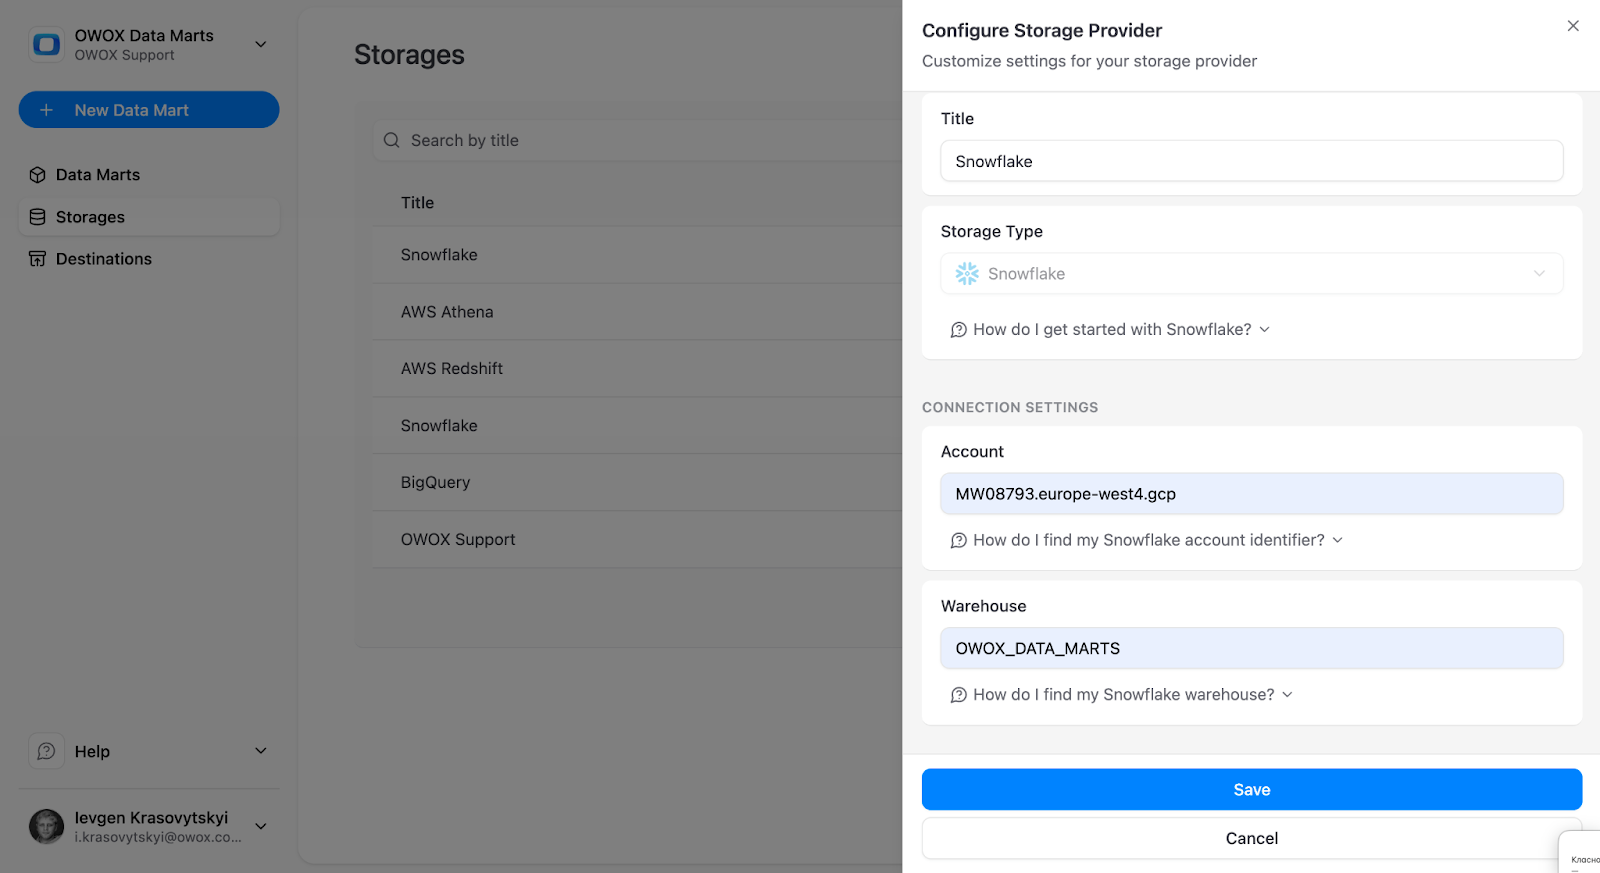
4. Enter Snowflake connection details
Provide the required connection parameters:
- Account Locator and Account Identifier (for example, mycompany-xy12345.eu-central-1)
- Warehouse Name (for example, WH_MARKETING_ANALYTICS)
These define where Microsoft Ads raw data and data marts will be created.
5. Choose an authentication method
OWOX supports two authentication approaches:
- Password-based (username + password)
- Key-based (requires admin permissions)
Enter:
- A Snowflake username (a dedicated technical user is recommended)
- The corresponding password or private key credentials
- Click ‘Save’
Using a dedicated technical user ensures controlled permissions and easier auditing.
Step 2: Create LinkedIn Ads Data Mart
With Snowflake connected, the next step is to create a LinkedIn Ads data mart inside OWOX Data Marts. This is where you authorize access, choose what accounts and fields to ingest, and publish a governed dataset in Snowflake that’s ready for reporting, blending, and automation.
Authorize Linkedin Ads & Choose Accounts
OWOX uses LinkedIn’s authorization flow to securely connect to your ad accounts. You’ll need access to the relevant LinkedIn Business Center or ad accounts.
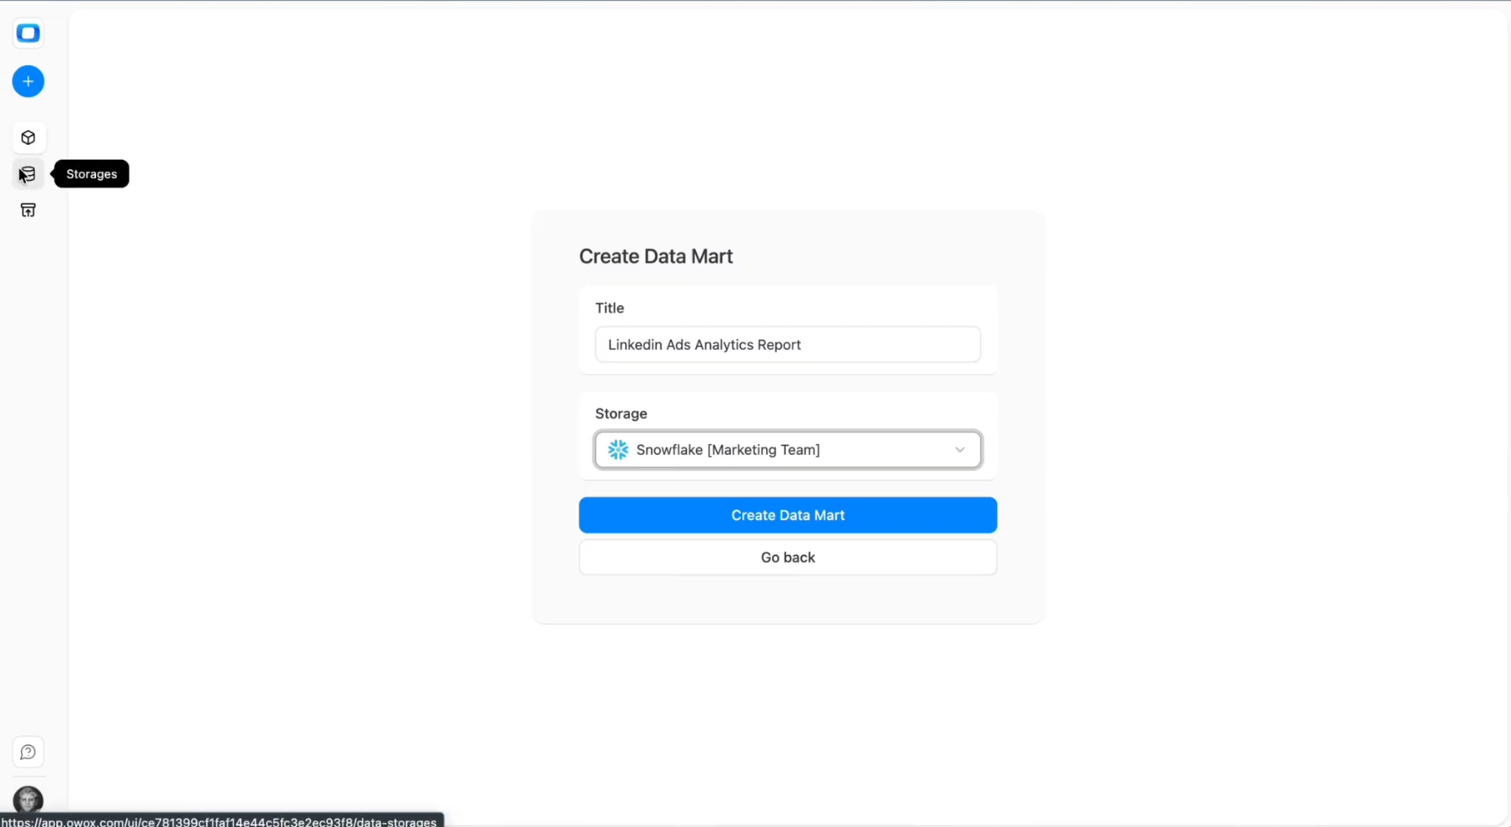
- In the OWOX UI, go to '+ New Data Mart'.
- Give the data mart a clear title, for example, 'LinkedIn Ads Analytics Report'.
- Select Snowflake as the Data Storage.
- Click 'Create Data Mart'.
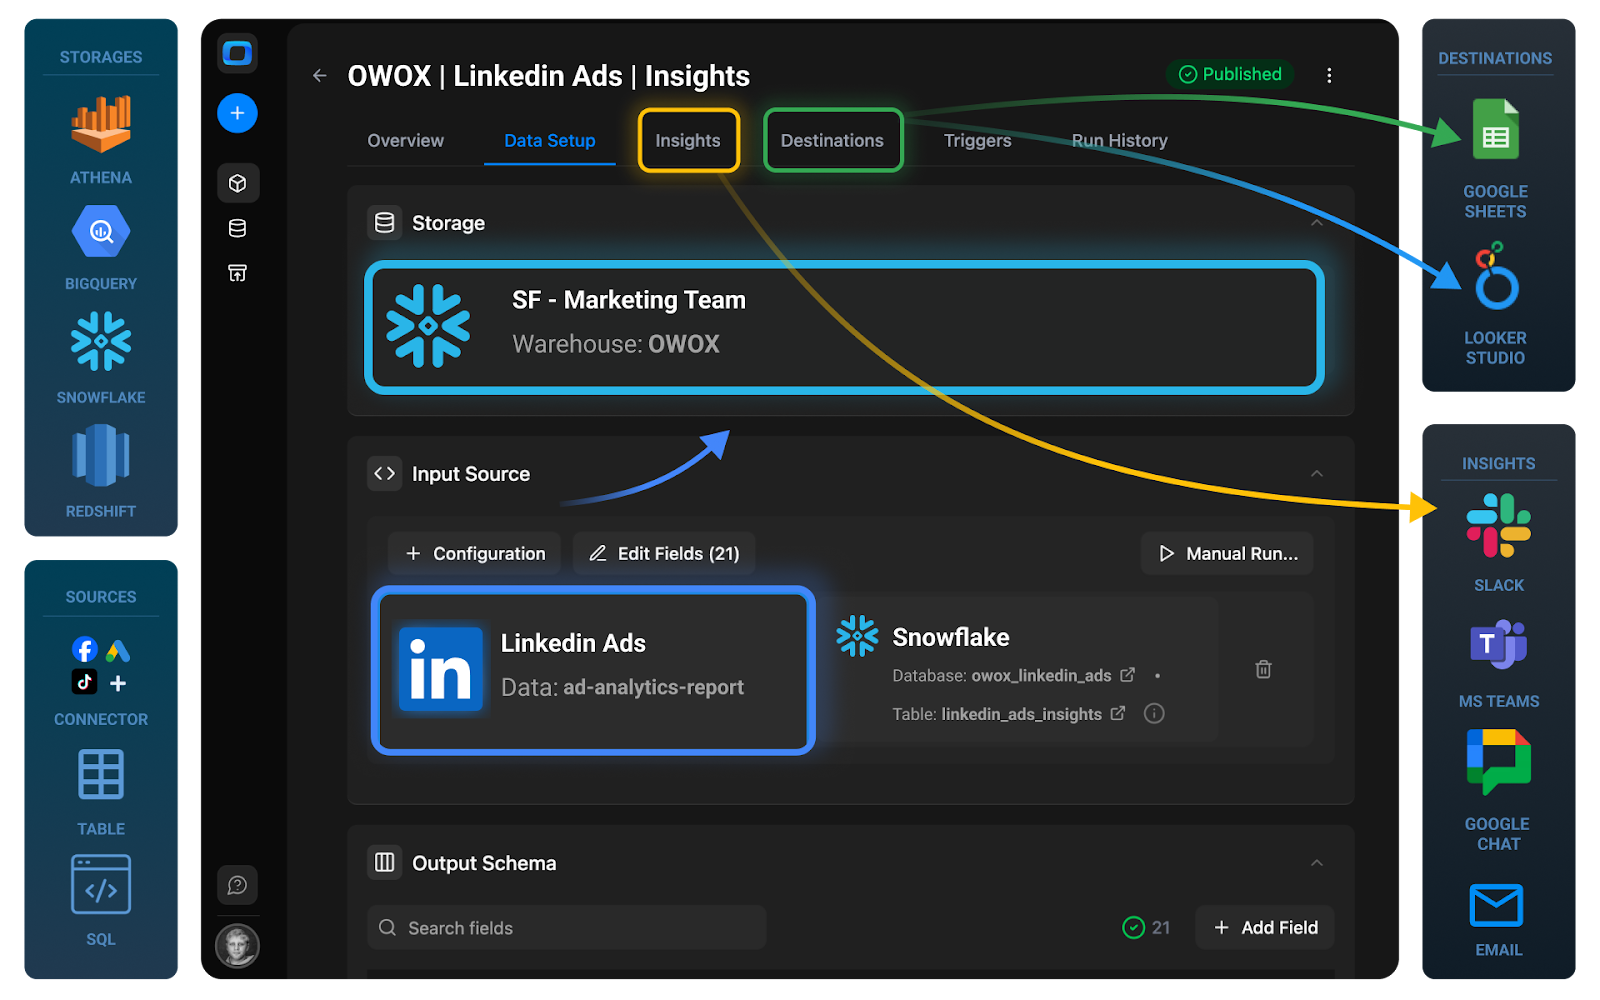
Configure Data Mart
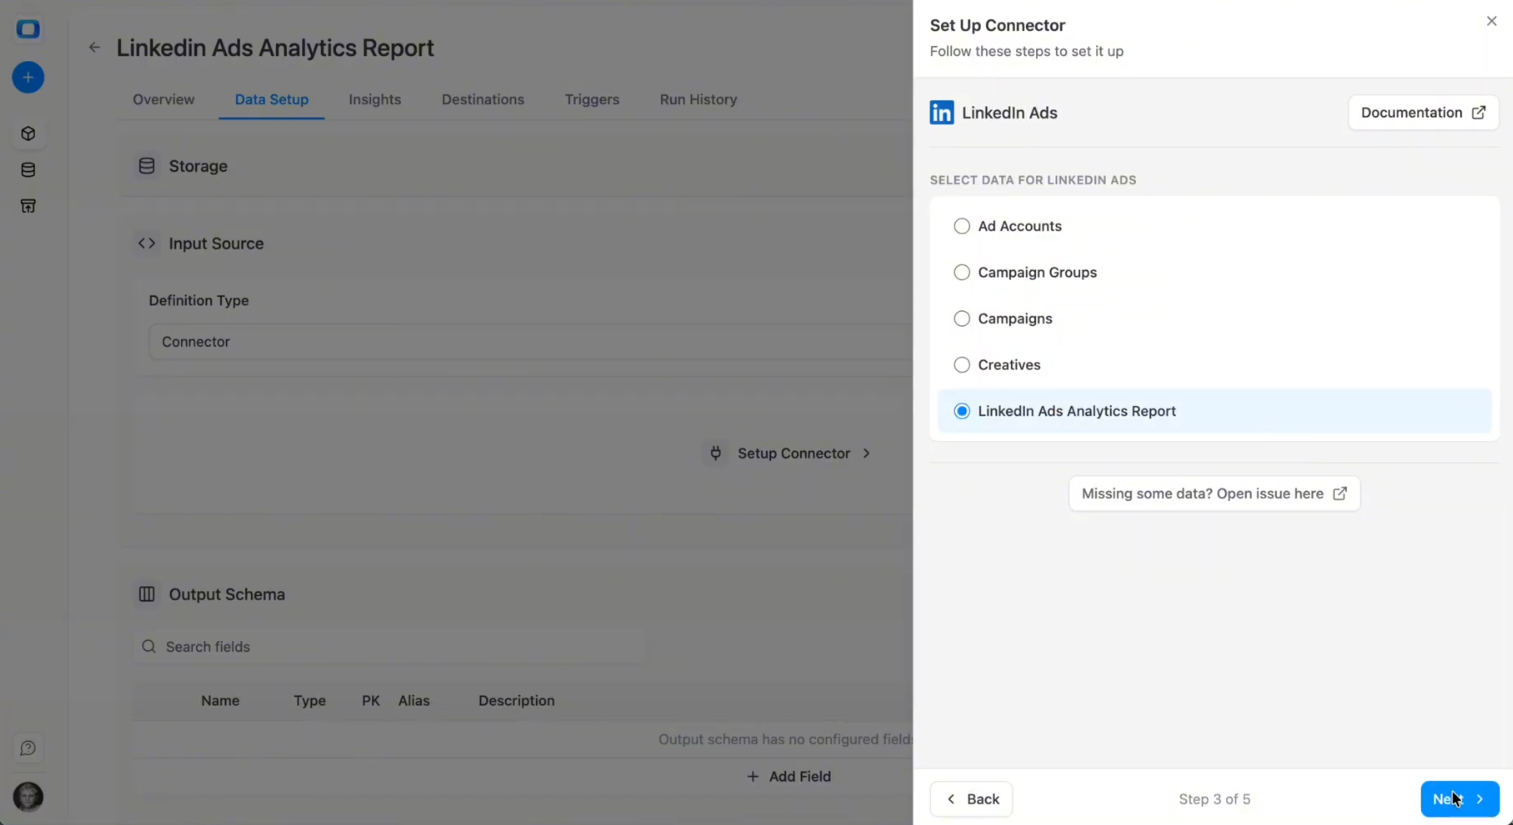
- Select 'Connector' as an 'Input Source'
- Choose 'LinkedIn Ads' as the 'Connector'
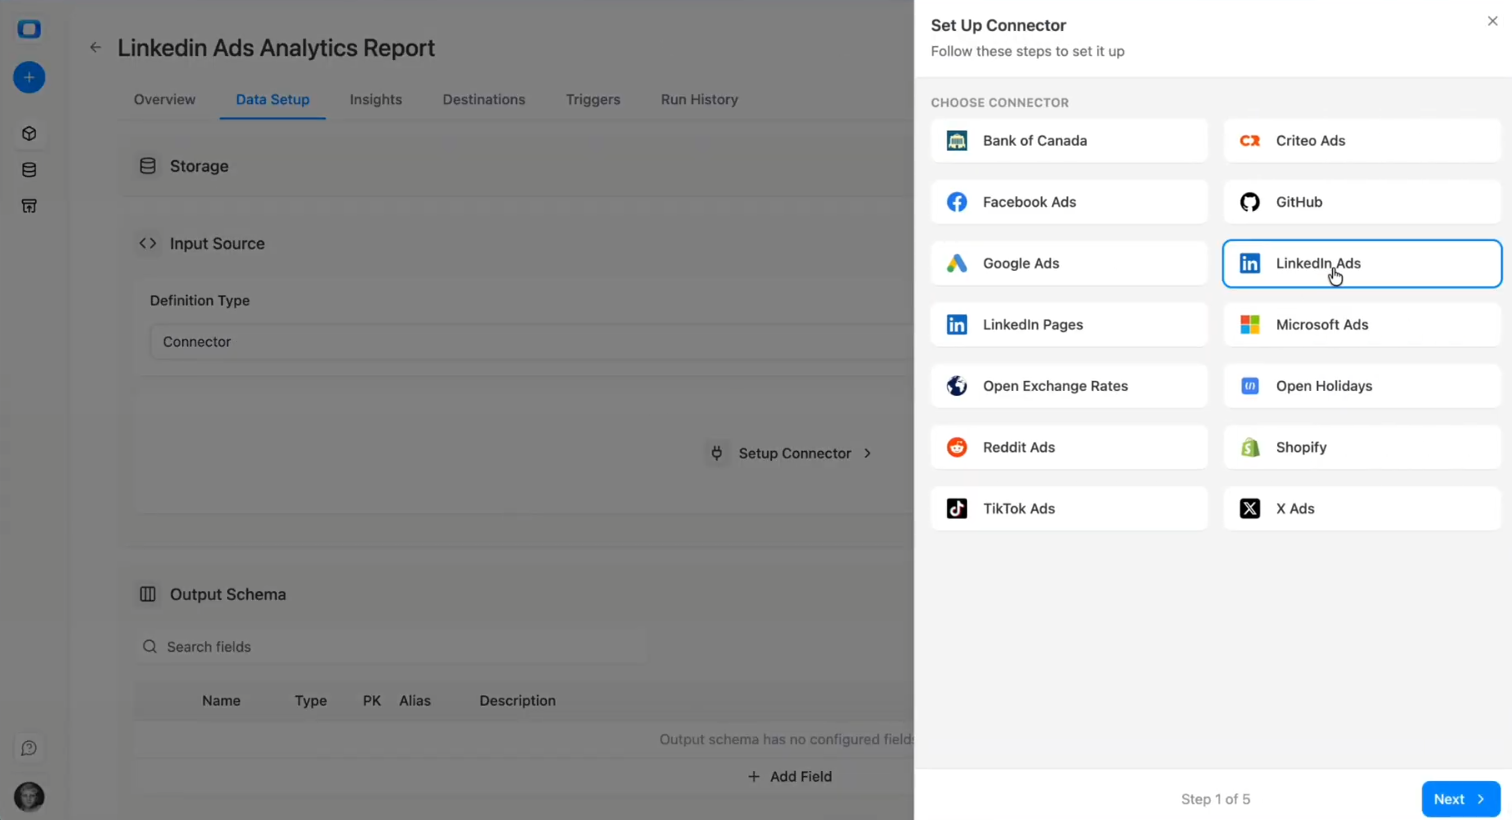
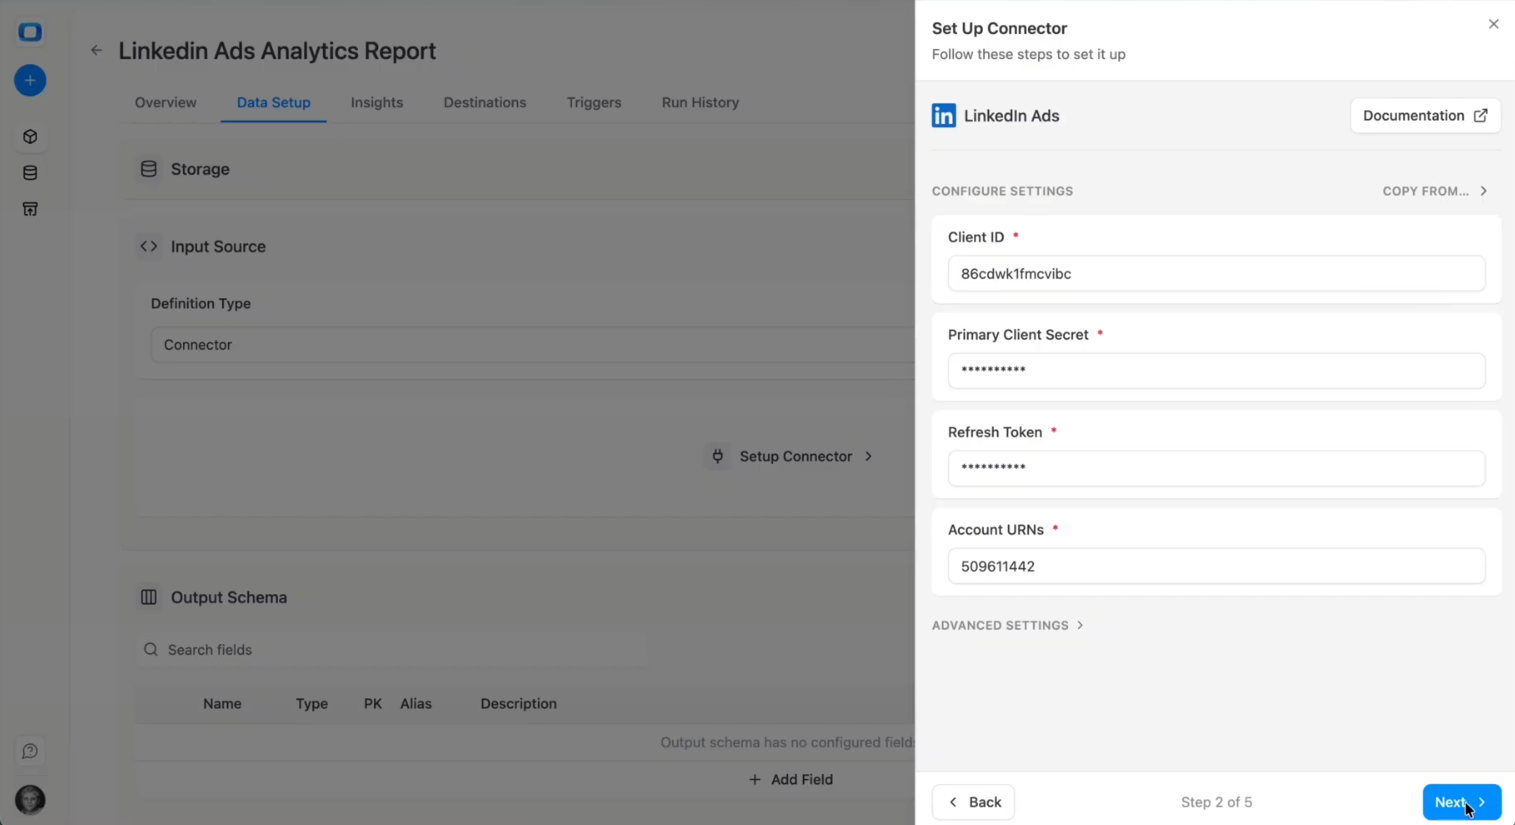
- Authorize using OAuth (you'll be redirected to LinkedIn's login and permissions screen)
- Log in with a user that:
- Has access to all LinkedIn Ads accounts you want to ingest.
- Has read access to campaign and performance data.
- Add your LinkedIn Ads Account ID(s) and click Next.
- Select the performance API endpoint with the campaign, ad group, keyword, or ad-level data
- Click 'Next'
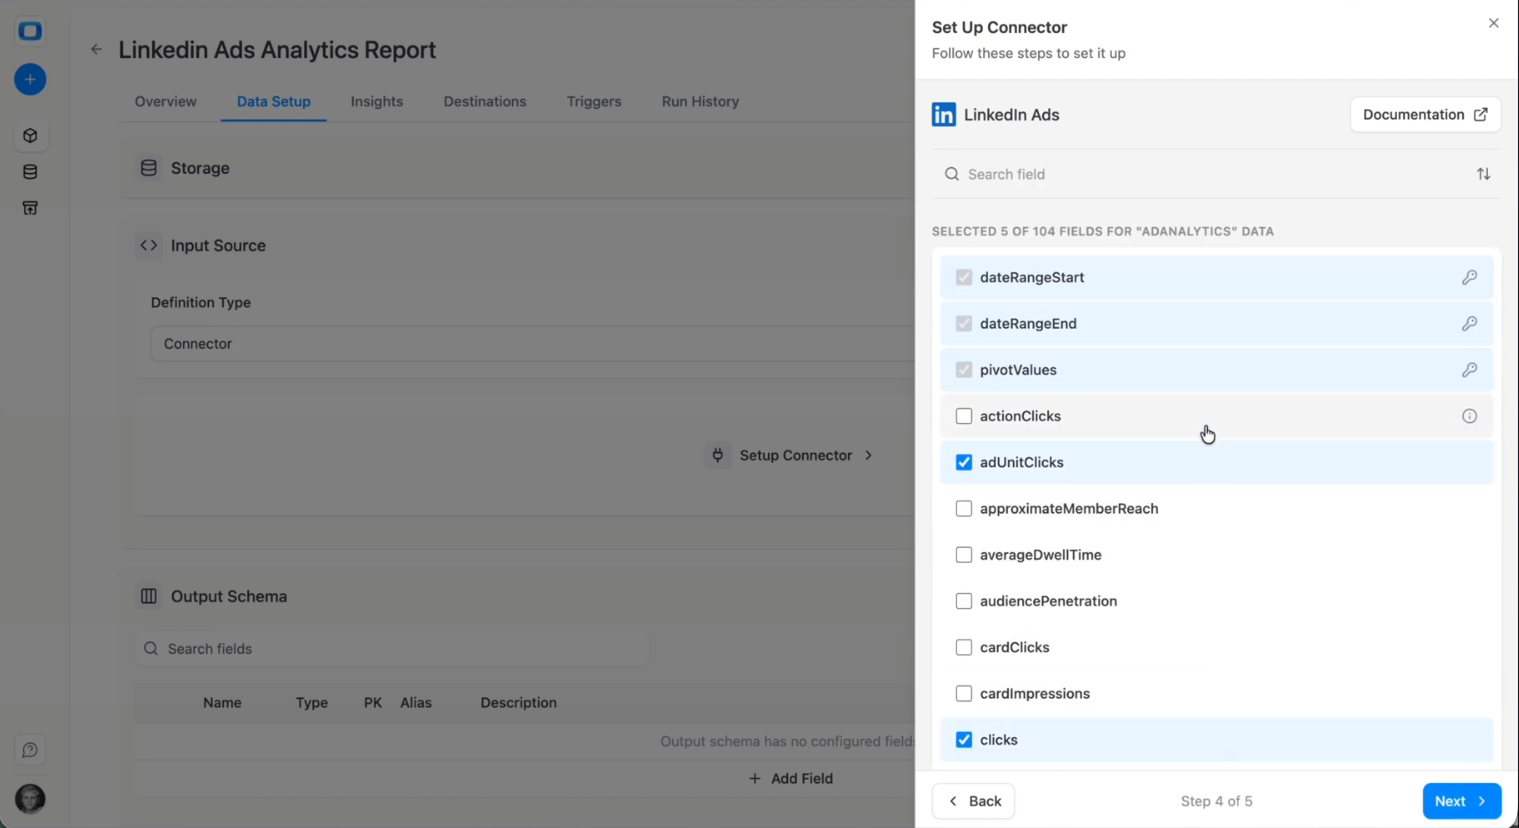
- Select the fields you want to collect – metrics such as impressions, clicks, cost, conversions, and conversion value.
- Click 'Next'
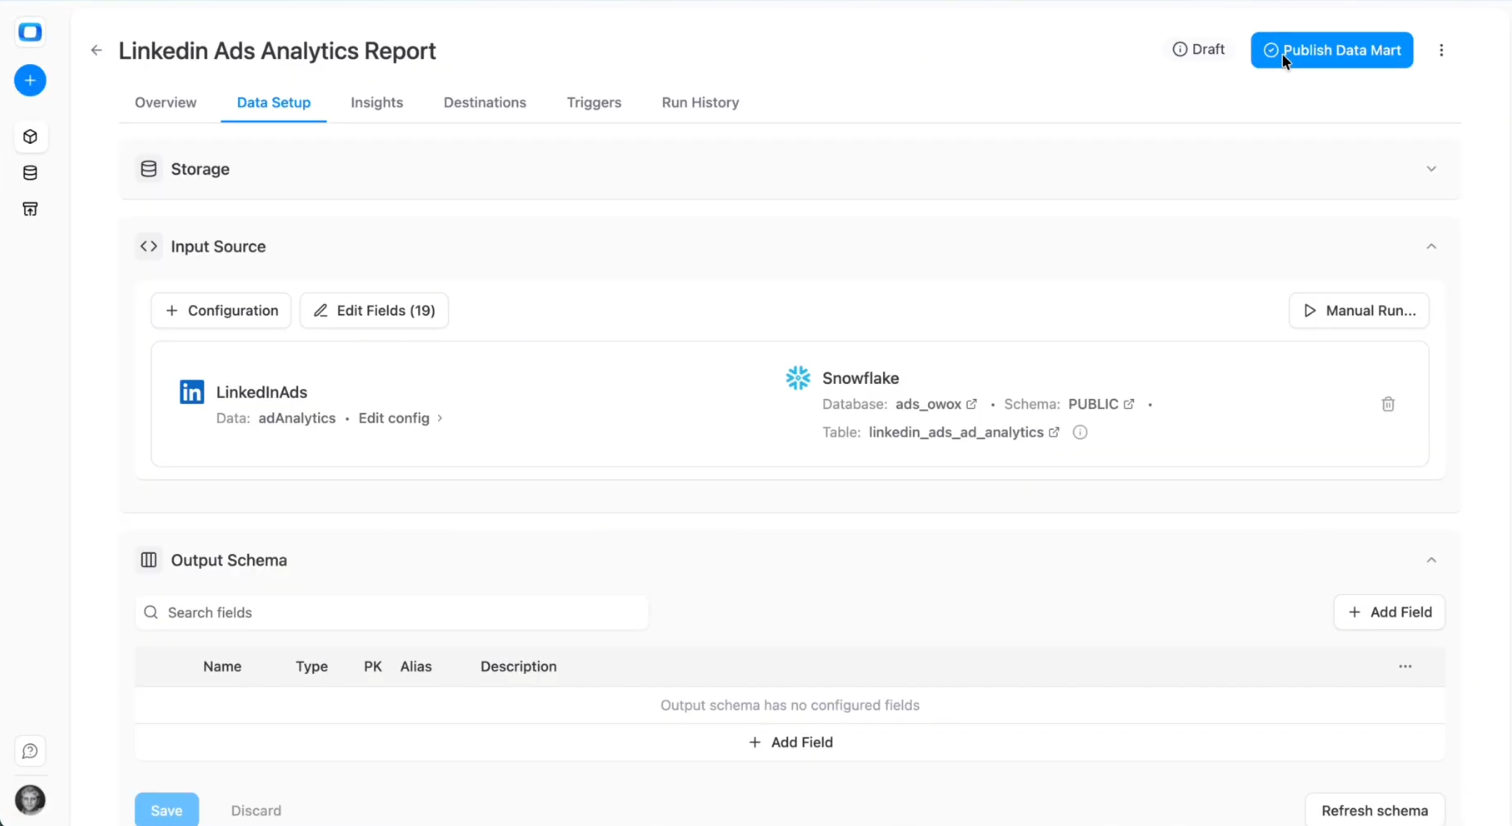
- Select your storage details like Database, Schema, and Table.
- You can keep the defaults – the table will be created automatically.
- Click 'Save'
- Then click 'Publish the Data Mart’
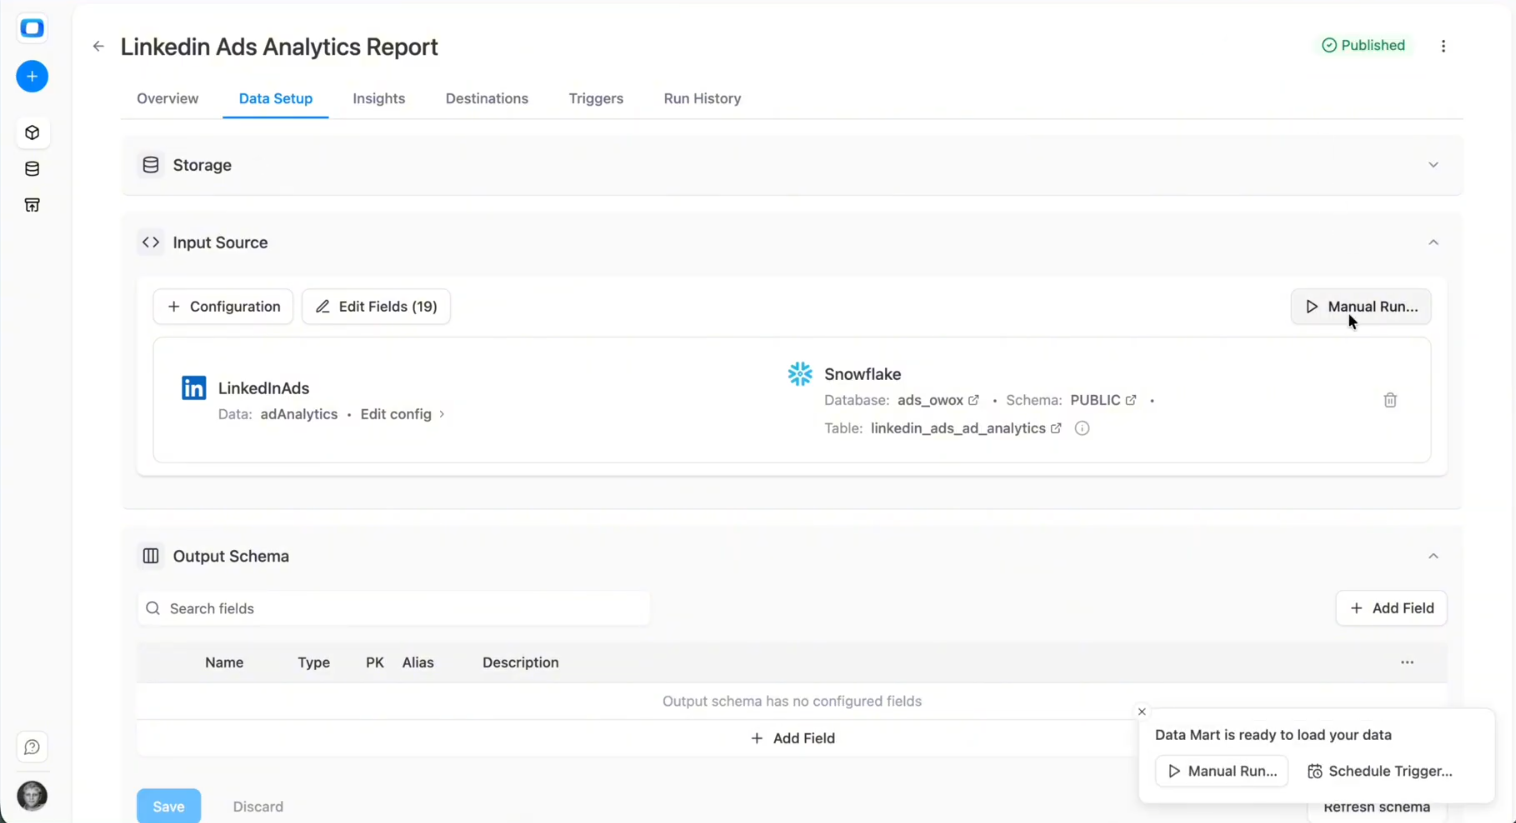
Run Your Linkedin Ads Connector
It’s time to do the first pull to confirm that data is flowing correctly. OWOX connects to the LinkedIn Ads API and lets you control what gets loaded into Snowflake.
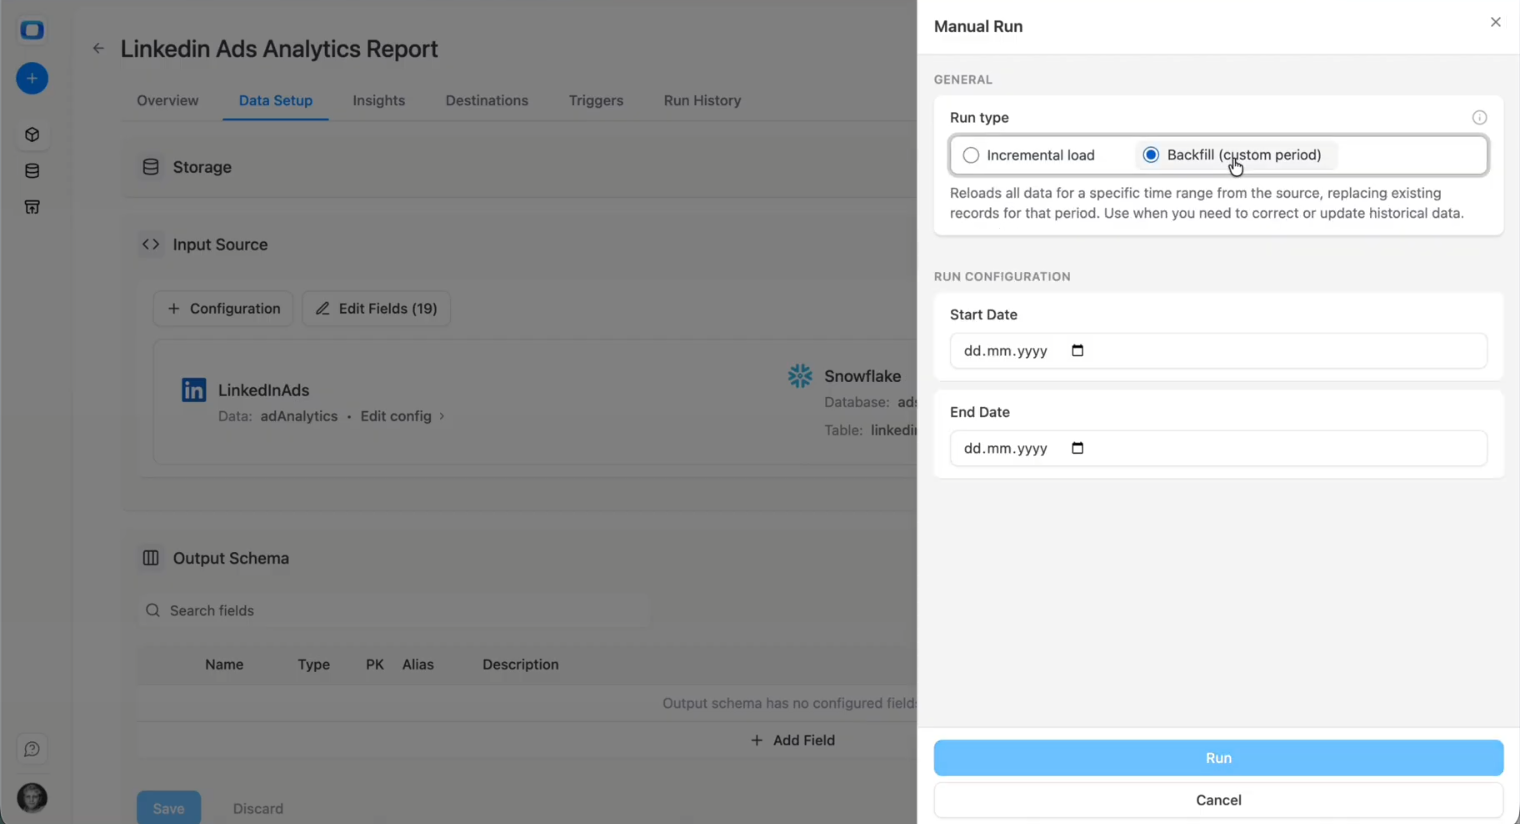
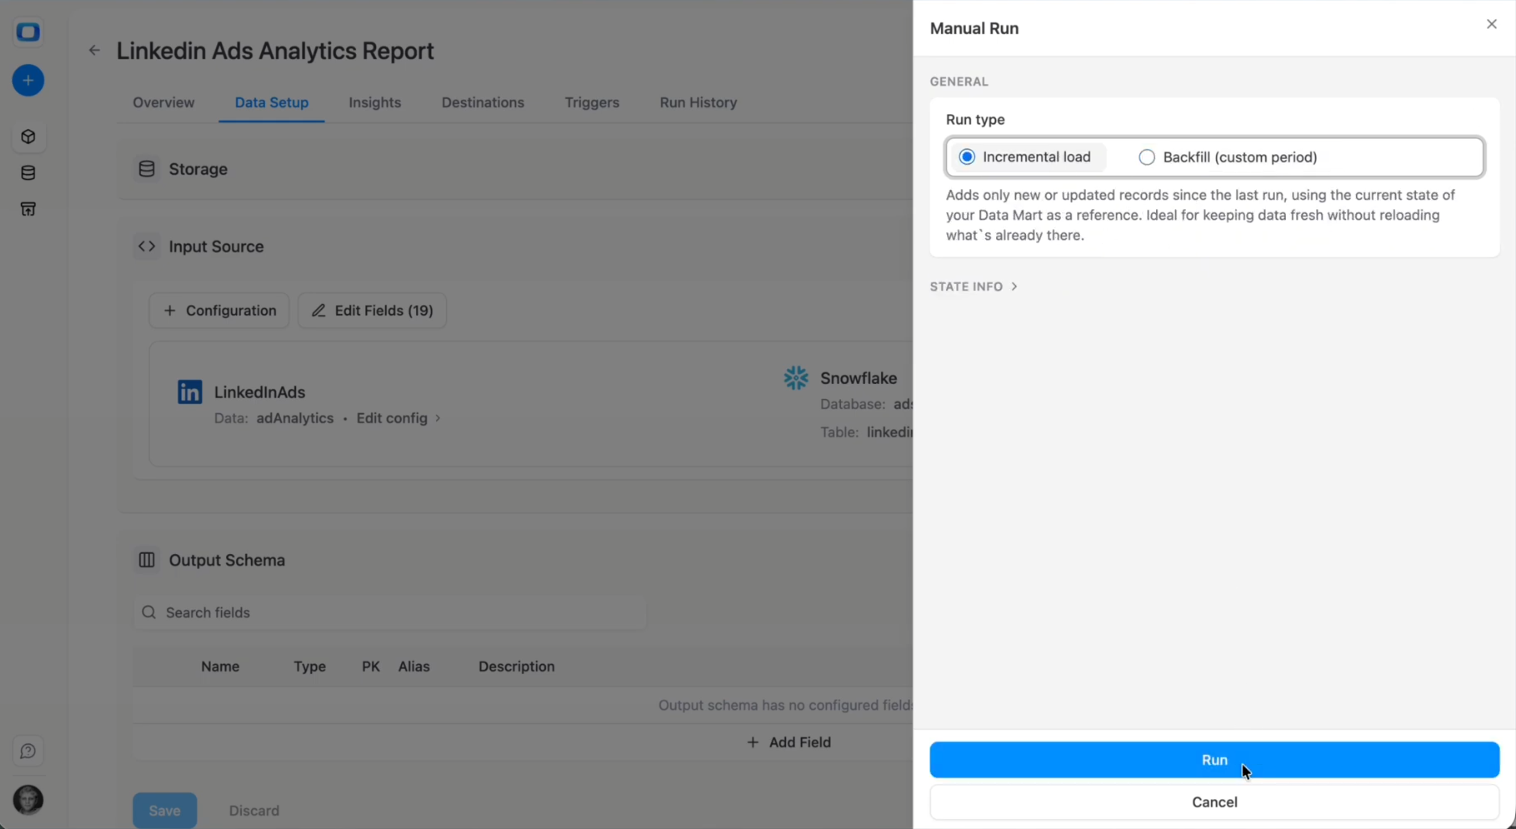
- Click on the 'Manual Run' button
- You'll see two options: Incremental or Backfill
Historical backfill
You decide how far back to load data. Use Backfill if this is your first run, and select the historical window you need.
You can choose 3 days, 7 days, 365 days, or multiple years.
Recommendations:
- For an initial setup, 90 days is often a practical balance between historical context and load time.
- If migrating from another system, consider a full fiscal year if you rely on year-over-year comparisons.
- Be mindful of API rate limits and data volume, especially for large or MCC-managed accounts.
Incremental load
To handle late conversions and attribution updates, OWOX supports a rolling lookback window.
Example configuration:
- On every run:
- Pull data for today + last 2 days.
- Overwrite those days in Snowflake.
This ensures:
- Recent performance data remains accurate.
- You avoid reprocessing the entire historical dataset each time.
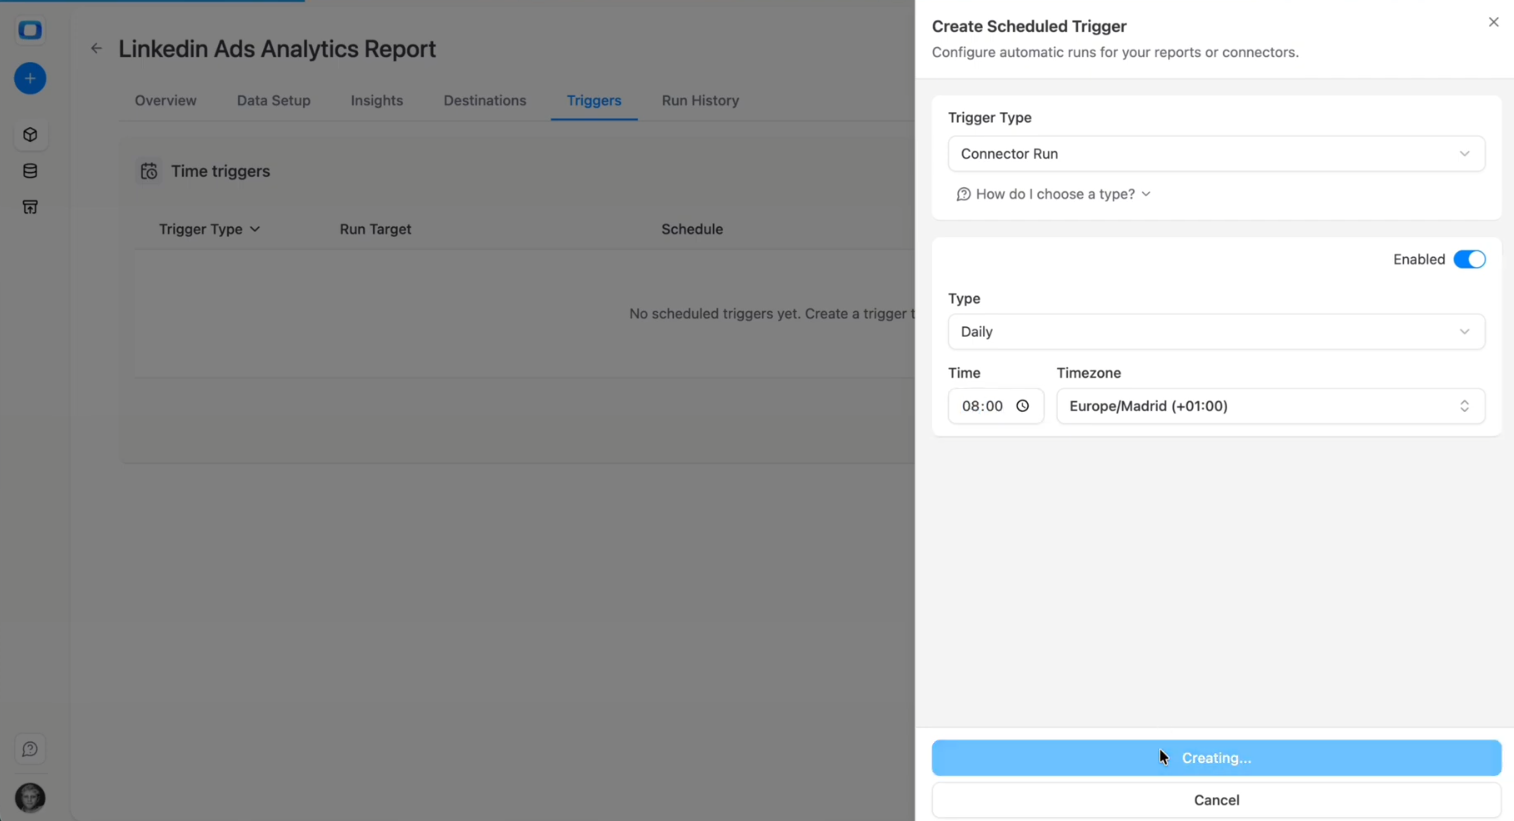
Scheduling
LinkedIn Ads data updates daily – and sometimes retroactively as conversions are attributed or adjusted. You’ll want to configure a schedule for ongoing updates and monitoring.
Go to the Triggers tab:
- Select Connector Run as a Trigger Type.
- Then configure Frequency:
- Daily (e.g., every night at 02:00) for most reporting needs.
- Intra-day (e.g., every 4 hours or every 15 minutes) if you need near-real-time visibility.
- Align the time zone with your business reporting timezone (for example, the LinkedIn Ads account timezone).
- Click ‘Create Trigger’ to activate the schedule.
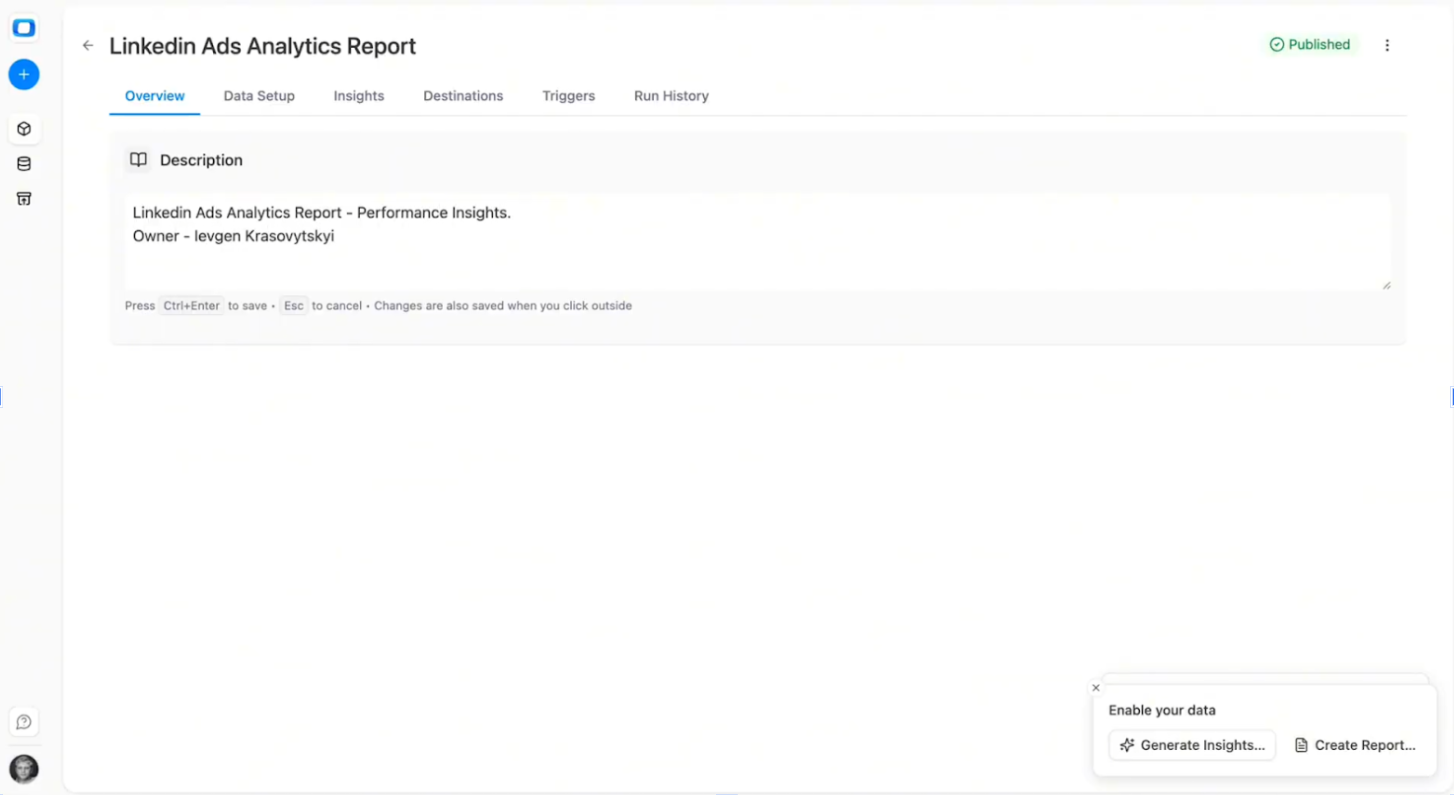
Linkedin Ads Connector Meta Data
With OWOX Data Marts, you can document your Linkedin Ads data mart to keep it organized and easier to manage over time.
Go to the Overview tab and add a clear Description that explains:
- What the LinkedIn Ads data mart contains (e.g., campaign, ad group, and keyword performance data)
- The reporting grain (daily reporting level across campaigns and keywords)
- Who owns or maintains the LinkedIn Ads reporting layer
- Any important modeling notes, such as KPI definitions or cross-channel alignment logic
This step is optional – but documenting your LinkedIn Ads data marts improves collaboration and makes long-term maintenance significantly easier.
Control (for Data Teams)
Go to the Run History tab to monitor every execution of your LinkedIn Ads data mart, covering both connectivity and data processing.
You can review:
- Run status (success, running, failed)
- Start and end time
- Execution duration
- Number of rows processed
- Error details (e.g., expired credentials, permission issues, API limits)
If a run fails, open the logs to identify the issue and re-run the connector after resolving it.
Data Marts Best Practices
When setting up a new LinkedIn Ads data mart, follow these simple rules:
- Start with a smaller subset (for example, one ad account) and a limited set of fields to validate structure and completeness.
- Add all active LinkedIn advertising accounts only after you confirm the configuration works as expected.
- Expand fields gradually using ’+ Fields’ so your Snowflake schema updates cleanly.
- Add a clear description once setup is complete to document ownership and reporting scope
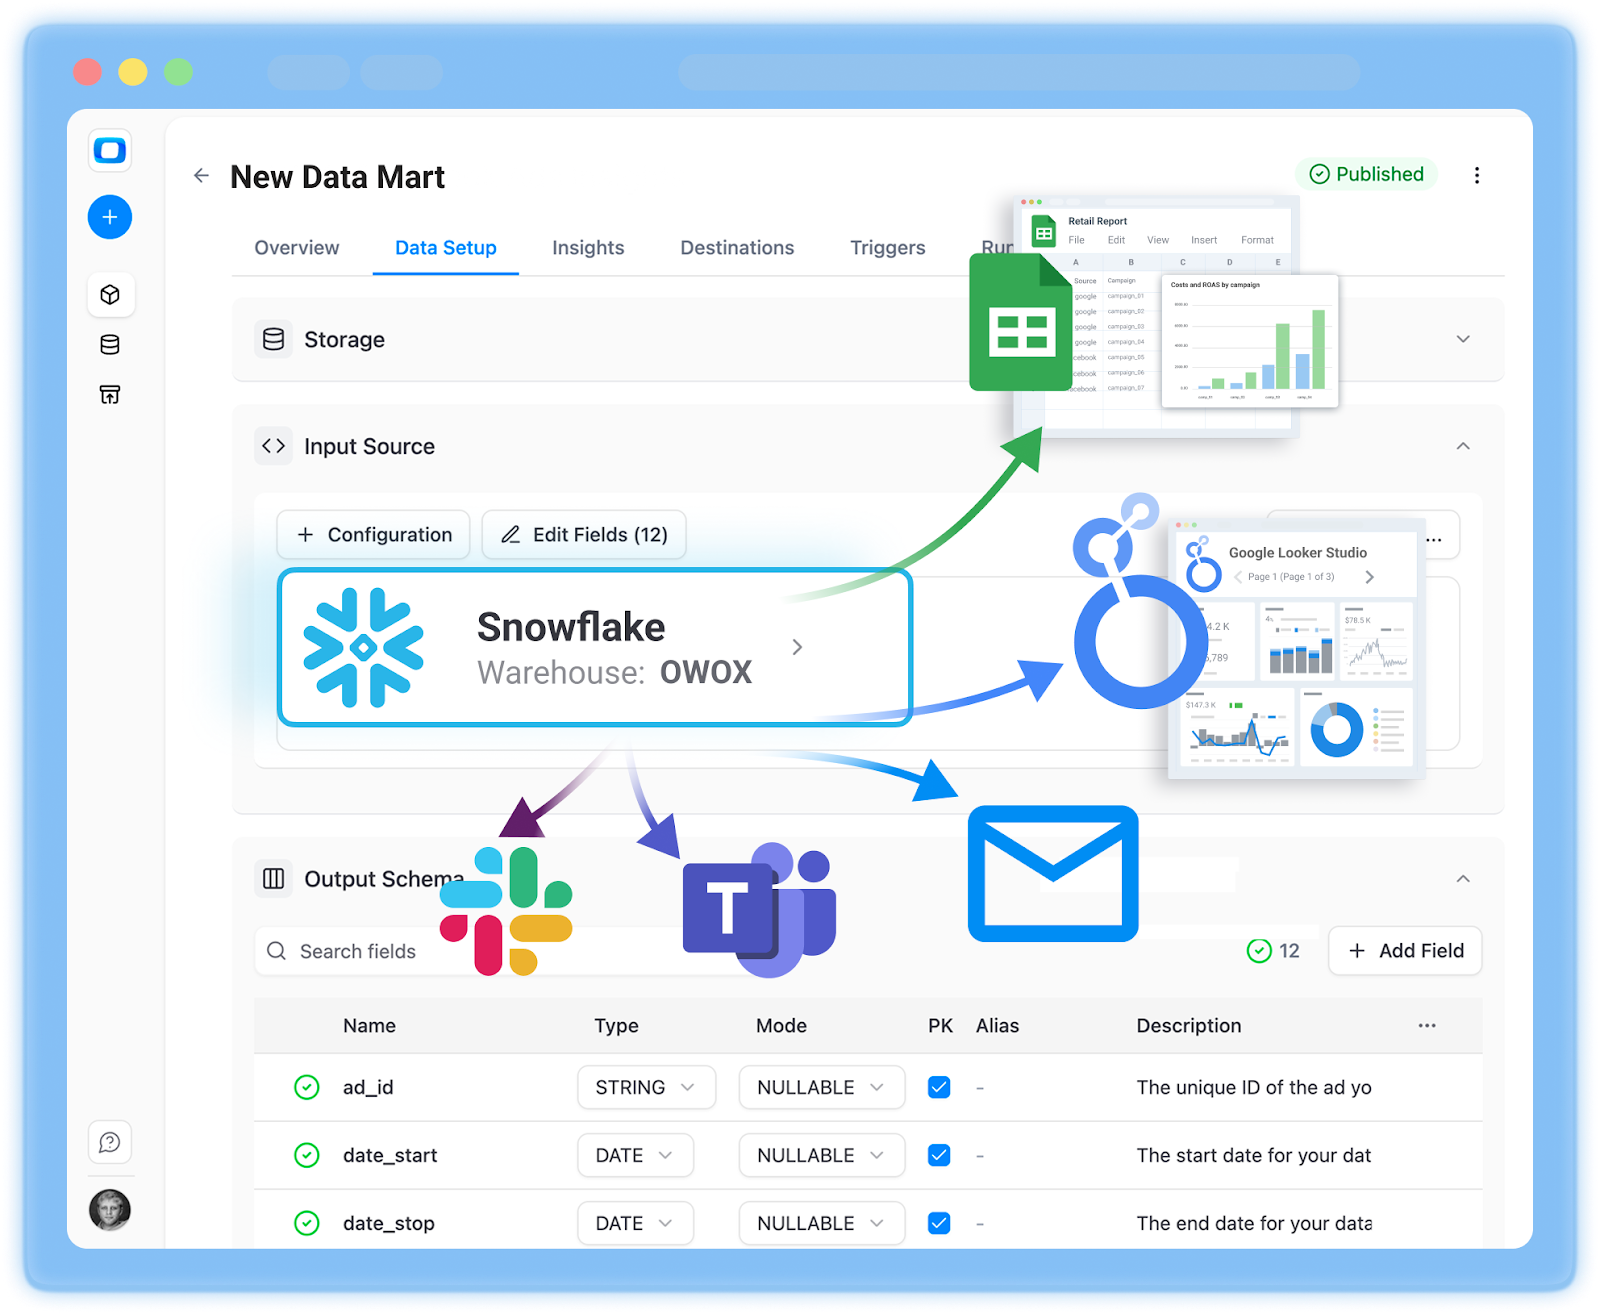
Step 3: Re-Use LinkedIn Ads Data Mart for Reporting
With a governed LinkedIn Ads data mart live in Snowflake, you can move beyond native campaign dashboards and manual exports. The data mart becomes a reusable reporting layer for spreadsheets, BI tools, and multi-channel B2B analysis.
LinkedIn Ads plays a central role in B2B demand generation, often driving mid-funnel and bottom-funnel conversions such as Lead Gen Form submissions, demo requests, and content downloads. Because these touchpoints frequently precede SQLs and opportunities, consistent modeling inside Snowflake ensures that performance is evaluated beyond surface-level engagement metrics. By structuring LinkedIn campaign data alongside CRM stages, you create visibility from initial click to pipeline contribution.
Now, you can:
- Connect Google Sheets and Looker Studio directly to your LinkedIn Ads data mart
- Compare LinkedIn performance with other paid channels inside Snowflake
- Run ROI and pipeline analysis using standardized KPI definitions
The goal is to make the LinkedIn Ads data mart the default source of truth for B2B marketing performance.
Connecting to Google Sheets & Looker Studio to your data mart
You don’t need to change reporting tools to benefit from Snowflake modeling. As long as a tool can connect to Snowflake, it can query the LinkedIn Ads data mart using standardized metrics and dimensions.
LinkedIn Ads to Google Sheets
To use Google Sheets for reporting:
- Go to the Destinations tab in OWOX Data Marts
- Connect Google Sheets as a destination
- Create a new report and provide the sheet URL
- Configure the refresh schedule
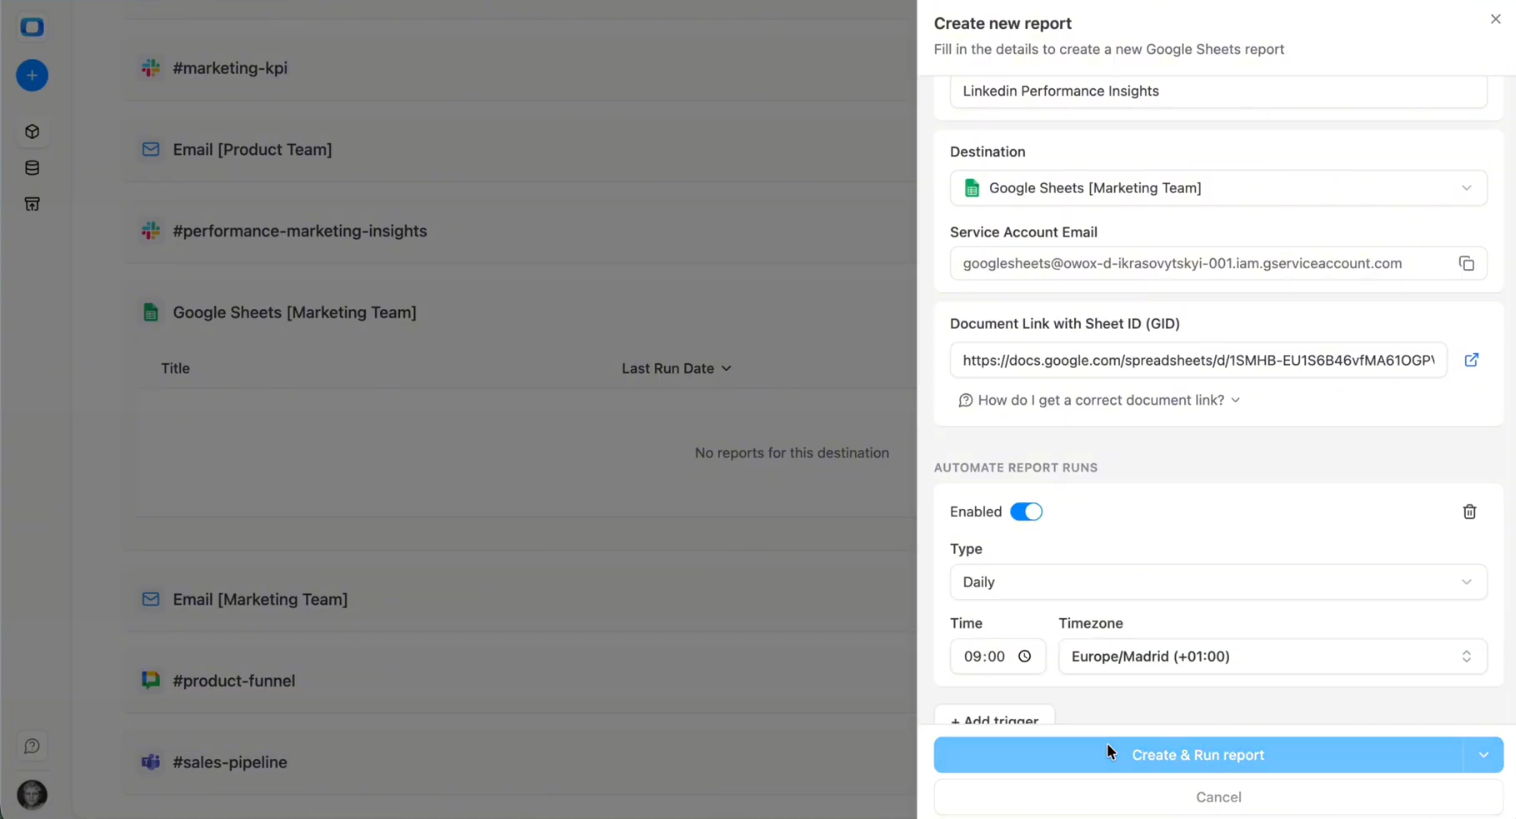
This allows marketing teams to access live LinkedIn campaign performance in spreadsheets without manual CSV exports.
Best practices:
- Use read-only tabs for synced data
- Keep transformation logic inside Snowflake, not in formulas
- Document that the LinkedIn Ads data mart powers the sheet
Because KPI definitions are governed inside Snowflake, Sheets becomes a visualization and collaboration layer rather than a transformation engine.
Connecting to Looker Studio
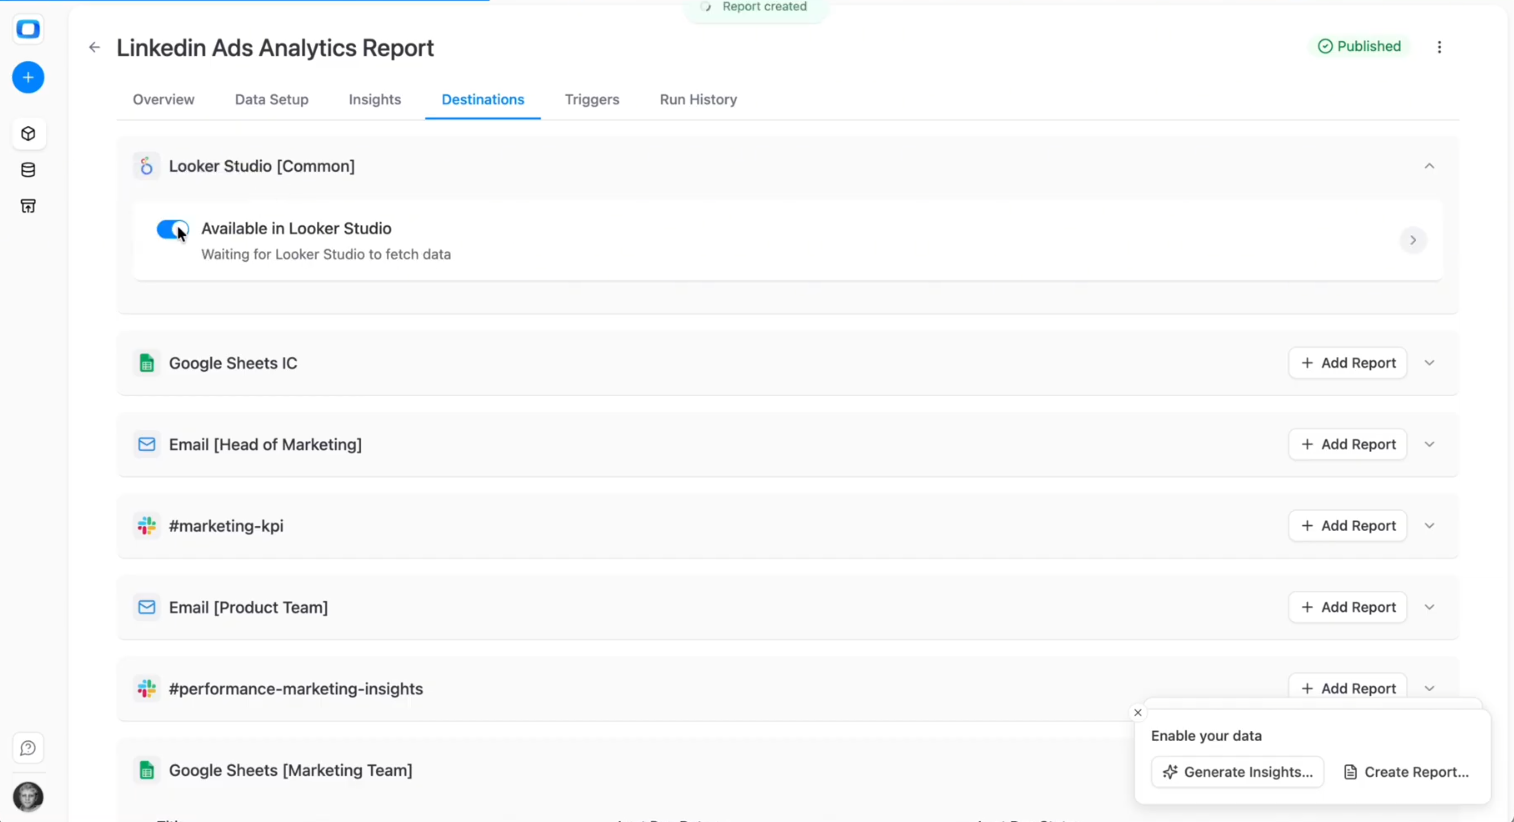
Connecting Looker Studio to OWOX Data Marts is pretty simple. In the OWOX Data Marts UI, navigate to Destinations in the main navigation pane, then click “+ New Destination”.
- Select Looker Studio from the Destination Type dropdown.
- Provide a Title – a unique name for this Destination (e.g., “Looker Studio Access (Marketing Team)”).
- Click Save.
- Then open it again and follow the instructions from Looker Studio.
Example Analytics Use Cases for LinkedIn Ads Data
Once your LinkedIn Ads data mart is live in Snowflake, the real value comes from applying consistent business logic to campaign and B2B performance analysis.
Because everything is modeled inside Snowflake, you can:
- Maintain consistent metric definitions across teams
- Compare performance across accounts and segments
- Align spend directly with lead and revenue outcomes
Below are practical analysis patterns enabled by the LinkedIn Ads data mart.
1. Campaign and Creative Performance Reporting
LinkedIn campaigns often target specific audience segments and B2B roles. Because LinkedIn targeting frequently includes job titles, industries, company size, and account-based audiences, segment-level performance analysis becomes critical. Inside Snowflake, you can break down CPL, SQL rate, and opportunity creation by audience attributes to understand which segments drive the highest pipeline efficiency - not just the most clicks. With standardized daily data, you can analyze:
- Impressions and clicks by campaign
- Spend allocation across targeting strategies
- Conversion volume by audience segment
- Cost per lead (CPL) trends
Because reporting grain and KPI logic are defined during data mart configuration, campaign comparisons remain consistent across dashboards and time periods.
2. B2B Funnel Performance and Lead Efficiency
LinkedIn Ads frequently support mid-funnel and bottom-funnel B2B objectives.
Inside Snowflake, you can:
- Track lead generation by campaign
- Evaluate conversion efficiency across segments
- Compare CPL across targeting approaches
- Monitor demand generation performance over time
This structured approach supports decision-making around budget allocation and targeting refinement.
3. Revenue and ROI Analysis for LinkedIn Campaigns
Beyond platform-level metrics, the LinkedIn Ads data mart supports deeper ROI evaluation.
With governed spend and conversion data, you can:
- Compare spend against attributed revenue
- Evaluate return on ad spend (ROAS)
- Support pipeline performance reporting
- Align LinkedIn campaigns with broader marketing KPIs
When LinkedIn Ads operates as part of a multi-touch B2B funnel, Snowflake modeling allows you to apply consistent attribution windows and credit allocation across channels. Instead of relying solely on platform-reported conversions, you can evaluate how LinkedIn influences opportunities across first-touch, last-touch, or blended attribution models.
Blending LinkedIn Ads with Other Marketing Channels
Because the LinkedIn Ads data mart lives inside Snowflake, it can be aligned with other paid media data marts using shared dimensions and naming conventions.
This is especially important for B2B teams using LinkedIn for account-based marketing and high-intent lead acquisition. By linking campaign identifiers to CRM records, you create a structured Lead → SQL → Opportunity → Revenue pathway that supports reliable pipeline attribution and budget reallocation decisions.
This enables:
- Cross-channel campaign comparison
- Unified reporting across search and social
- Consistent KPI definitions across platforms
When performance definitions are standardized inside Snowflake, LinkedIn Ads becomes part of a broader governed marketing analytics layer rather than an isolated reporting source.
Step 4: Turn LinkedIn Ads Data into Proactive Insights
Once your LinkedIn Ads data mart is live in Snowflake, you can move beyond passive dashboards and start operationalizing performance intelligence. Because metrics like spend, CPL, cost per SQL, cost per opportunity, and revenue attribution are standardized inside the warehouse, AI systems can analyze them consistently and deliver reliable recommendations.
This step focuses on transforming your governed LinkedIn Ads Snowflake foundation into automated, decision-ready insight workflows.
Configuring AI Insights for LinkedIn Performance
AI performs best when it operates on standardized, revenue-aligned metrics.
1. Frame the AI’s Role
Define whether AI should:
- Monitor campaign efficiency (CPL, cost per SQL)
- Detect pipeline contribution shifts
- Flag revenue attribution changes
- Identify underperforming audiences or regions
By clearly defining the objective, you prevent generic summaries and ensure the AI focuses on B2B ROI impact.
2. Specify Focus Metrics and Dimensions
Guide AI toward the KPIs that matter for LinkedIn B2B reporting:
- Spend
- Leads
- Cost per Lead (CPL)
- Cost per SQL
- Cost per Opportunity
- Revenue attribution
- Pipeline contribution
Include key dimensions such as:
- Campaign
- Ad group
- Industry
- Region
- Audience segment
Because these metrics are modeled in Snowflake, AI evaluates them using governed definitions instead of dashboard-level formulas.
3. Provide Business Context
AI insights become more actionable when tied to business constraints.
You can define:
- Target CPL or cost per SQL thresholds
- Acceptable cost per opportunity ranges
- Pipeline contribution goals by campaign
- Priority regions or industries
- Budget focus for strategic segments
This ensures AI outputs align with the B2B marketing strategy, not just raw performance variance.
Designing Insight Outputs for Marketing and Sales Teams
Insights must be structured for action, not just observation.
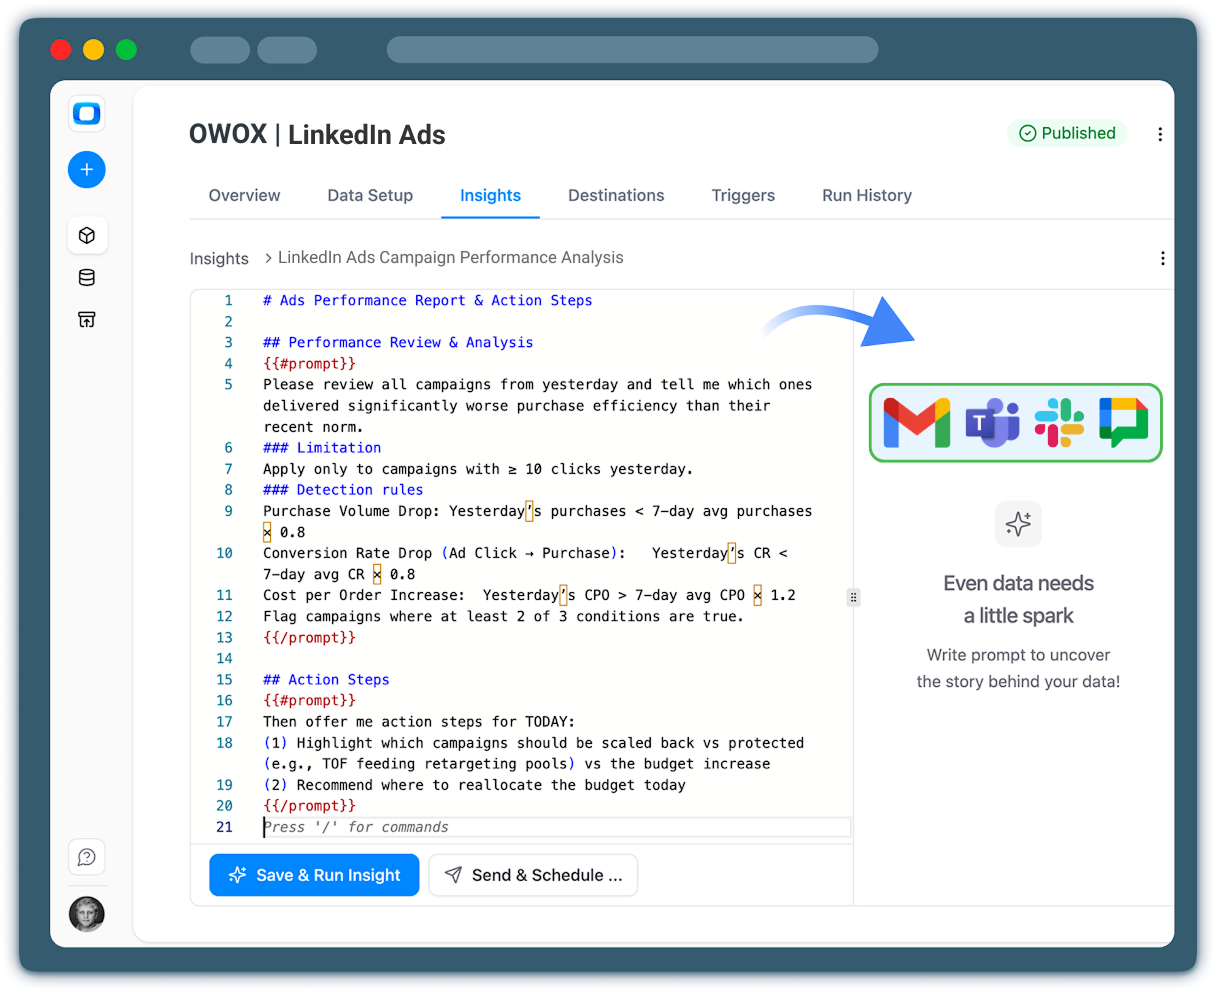
1. Make Outputs Clear and Business-Focused
Ask the AI to:
- Use plain language
- Highlight material performance shifts
- Compare against targets or historical baselines
- Connect campaign metrics to pipeline outcomes
Avoid raw data dumps. Focus on interpretation.
2. Separate Insights into Decision Categories
Structure outputs into:
- Key performance changes
- Risks or anomalies
- Recommended actions
For example, instead of listing cost increases, the AI can explain how rising CPL in a specific industry segment may impact SQL volume and downstream pipeline generation.
3. Align Insights Across Marketing and Sales
Because LinkedIn Ads often drives B2B lead generation, insights should bridge marketing and sales metrics.
Ensure summaries connect:
- Spend → Leads → SQLs → Opportunities → Revenue
This alignment reinforces cross-functional clarity and reduces reporting disputes.
Delivering Scheduled LinkedIn Insights Across Teams
Once LinkedIn Ads insights are configured and validated in Snowflake, the final step is controlled delivery. The goal is to push governed performance summaries from your Microsoft Ads data mart into the collaboration tools your team already uses.
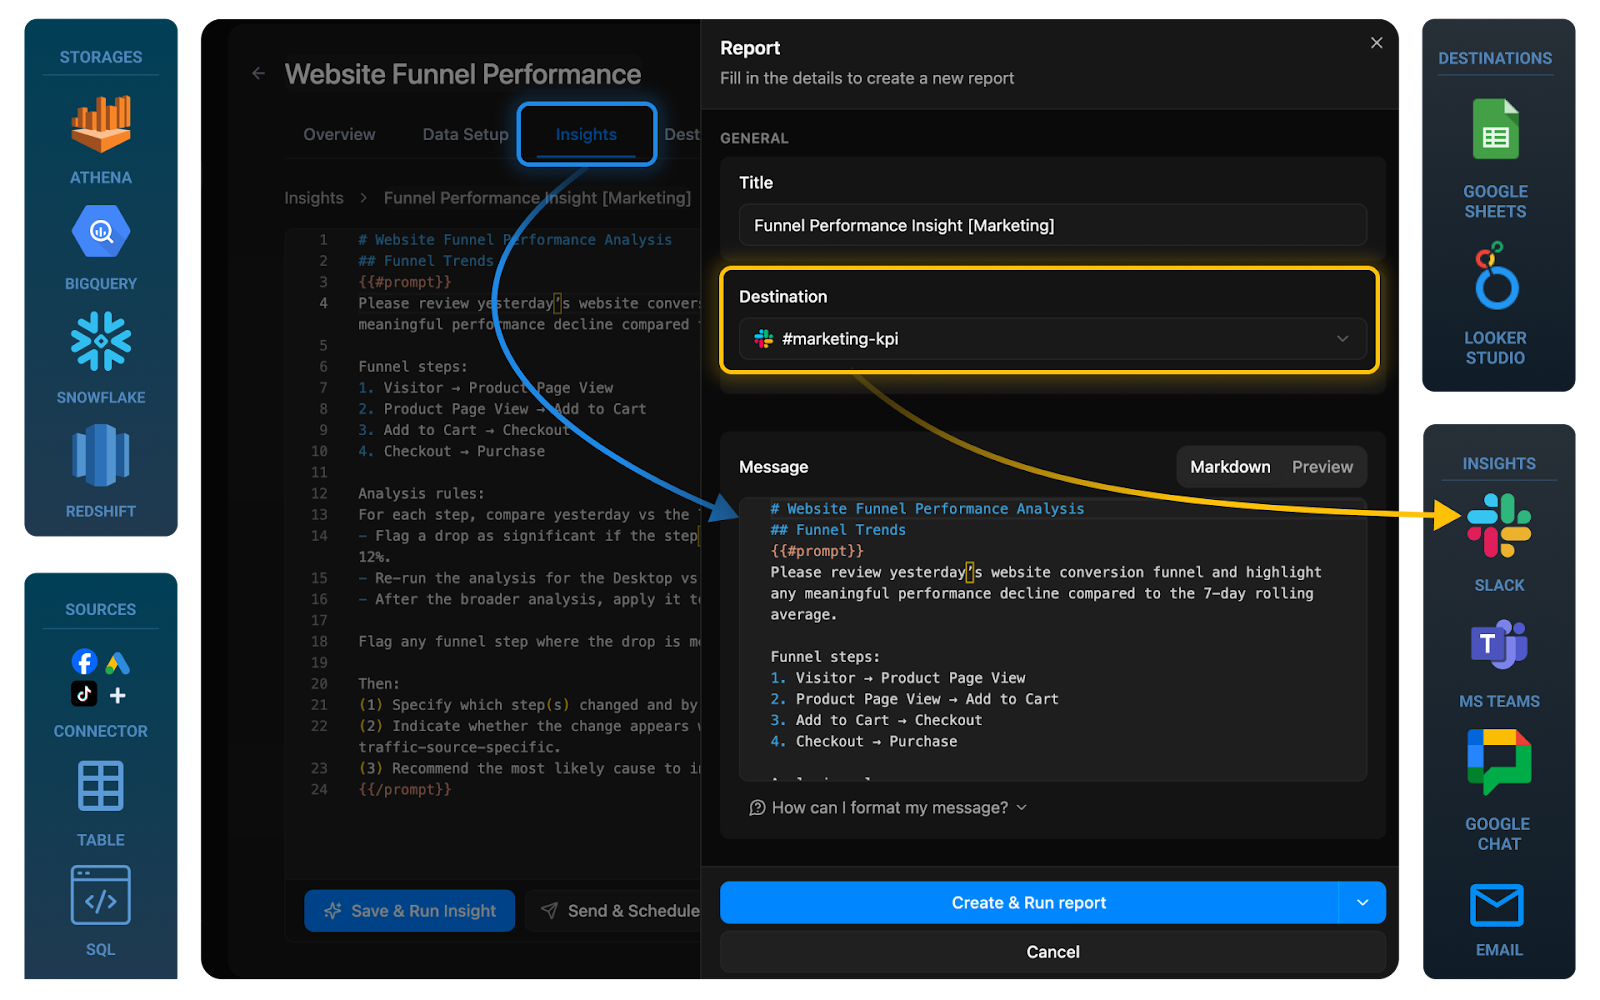
1. Configure Delivery Destinations
Choose where insights should appear:
- Slack marketing channels
- Microsoft Teams groups
- Email distribution lists
- Executive summary reports
Keep destinations aligned with how your paid search team reviews performance and escalates issues.
2. Tailor Frequency and Audience
Avoid alert fatigue by defining clear cadences:
- Daily: Campaign-level monitoring and anomaly detection
- Weekly: CPL, SQL, and opportunity trend summaries
- Monthly: Revenue attribution and pipeline impact analysis
You can also tailor outputs by role:
- Channel managers: Campaign-level breakdowns
- Sales leadership: Pipeline contribution and opportunity metrics
- Finance: Cost-to-revenue efficiency summaries
3. Continuously Improve and Scale
As LinkedIn activity expands, your AI configuration should evolve. Best practices:
- Review generated summaries with stakeholders
- Refine monitored KPIs as strategy changes
- Add new LinkedIn accounts or business units
- Extend attribution logic as CRM integrations deepen
Because the LinkedIn Ads data mart is governed and version-controlled inside Snowflake, updates to definitions propagate consistently across dashboards, AI workflows, and stakeholder reports.
Start Centralizing Your LinkedIn Ads Data in Snowflake
You now have a complete blueprint to move from fragmented LinkedIn Ads exports to a governed, scalable B2B analytics foundation.
By connecting LinkedIn Ads to Snowflake through OWOX Data Marts, you can:
- Automate LinkedIn Ads → Snowflake ingestion
- Build a standardized LinkedIn Ads data mart with trusted KPIs
- Model cost per lead, cost per SQL, cost per opportunity, and revenue attribution in one governed layer
- Blend LinkedIn performance with CRM and opportunity data for full-funnel visibility
- Deliver insights to Google Sheets, Looker Studio, Slack, or Microsoft Teams
- Enable AI-driven monitoring tied directly to pipeline and revenue outcomes
Instead of rebuilding attribution logic across dashboards or reconciling CSV exports every week, you centralize definitions once inside Snowflake and reuse them everywhere. With a marketing data mart Snowflake foundation, LinkedIn Ads reporting evolves from campaign-level optimization to pipeline-driven B2B performance analysis.
Marketing, sales, and finance teams align around the same cost-to-revenue metrics, reducing ambiguity and improving budget allocation decisions. As your LinkedIn investment grows, your data architecture scales with it - maintaining governance, standardization, and clarity across channels.
If you're ready to replace manual exports with a governed LinkedIn Ads Snowflake workflow and unlock consistent B2B marketing analytics, you can start building your LinkedIn Ads data mart in OWOX Data Marts today.
Frequently asked questions


Finally, a tool that doesn't ask business users to learn a new dashboarding UI. Our marketing team already knows Sheets. OWOX just delivers the right data.
Joinable data marts concept was the thing that sold us. We can now use the semantic layer without building one.
Self-hosted the OSS version on Digital Ocean. Zero vendor lock-in. Contributed a Shopify connector back in week two.