Easily collect Confluence data with OWOX Data Marts, store in your data warehouse, automate reporting across major BI Tools and AI Insights (the ones that matter) delivered straight to corporate messengers on a schedule.
Confluence is a collaboration software where teams can create, share, and collaborate on projects, documents, and ideas in real-time. It is used by teams to manage projects, track progress, and create and update content together.
Pull everything your company needs from Confluence without touching code, dealing with API, or maintaining custom scripts. OWOX Data Marts handle the heavy lifting so you don’t have to.
Set up Confluence data collection once and OWOX Data Marts automatially loads your Confluence data into your warehouse on schedule – reliably, securely, and with full control over export schema.
Your Confluence data lands on a schedule: clean, complete, and ready to re-use across reports & dashboards, across BI tools & spreadsheets, as well as instantly available for AI Insights delivered with your prompts on a schedule to corporate messengers.
Your Confluence data is stored in one place – your own infrastructure. OWOX Data Marts automatically land your data directly into BigQuery, Snowflake, Redshift, Databricks, AWS Athena, giving you full control over where it lives and how it’s used.
No vendor lock-in, no black-boxes, full fun history with every little detail (if you want). You get predictable scheduled Confluence uploads, transparent data schema, and an always-on flow of fresh Confluence data ready for visualization in BI tools, and AI Insights generated for your team.
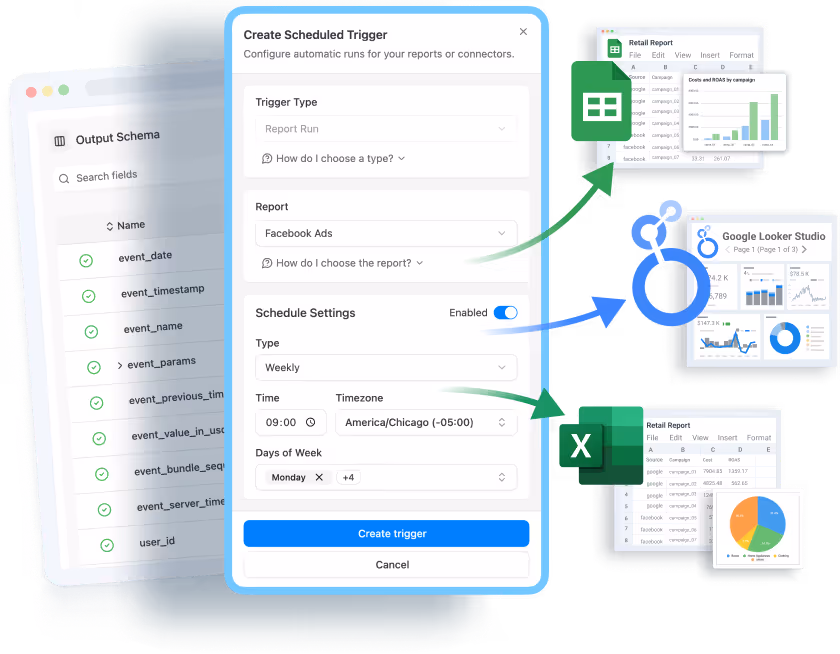
Once your Confluence data lands in your warehouse, OWOX Data Marts make it instantly re-usable across spreadsheets and BI tools. No manual stitching, no inconsistent metrics, no guessing which number is “correct.”
Your team works with the same clean, updated, analysis-ready Confluence data – powering performance reports, CAC & ROAS dashboards, creative insights, audience analysis, and anything else you need to run business growth.
And because the data is always fresh, AI Insights by OWOX can automatically summarize key changes, detect anomalies, and notify your team directly in Slack or corporate messengers, on a schedule.
With OWOX Data Marts, your Confluence data becomes instantly available for charts, dashboards, pivots, and spreadsheets – just schedule delivery right from the same data mart as you use for data collection.
Whether you're using Google Sheets, Looker Studio, Excel, Power BI, or any tool your team prefers, OWOX delivers clean, scheduled Confluence data that just works – including seamless access for AI Insights by OWOX to highlight changes and do analysis automatically.
OWOX makes your Confluence data flowing on schedule while AI Insights turns it into clear, actionable updates your team can actually use. No dashboard digging, no waiting for weekly syncs – just the metrics that matter, delivered automatically.
Your marketing, sales, finance, operations, product & actually data teams get instant visibility into changes – with AI Insights summarizing the key signals and sending them straight to your corporate messengers on a schedule.
OWOX Data Marts automates data collection from Confluence and other data sources, reducing manual data entry and ensuring data completeness & accuracy.
OWOX Data Marts offers a comprehensive view of your Confluence data and allows you to merge it with data from other sources to gain deeper insights.
OWOX Data Marts automates data transfer between Confluence and databases or analytic platforms, saving time and reducing errors.
OWOX Data Marts enables you to create blended reports by incorporating data from Confluence into other business reports.
When you connect Confluence with visualization platforms you make more sense of your data. Whether it's pivot table, spreadsheet, chart or graph - you get a comprehensive view & analyze your data faster.
Confluence provides a lot of data, but sometimes you may need to analyze that data in different ways. By connecting Confluence with data visualization tools, you get access to better visualization scenarios that can help you get deeper insights into your business data
When you connect Confluence with visualizations, you can customize your reports and dashboards to answer your specific business questions. Create custom charts, graphs, and tables to represent your data in a way that is easy to understand and act upon
By having a consolidated view of your business data and access to advanced analysis tools, you & your team can make better decisions. Use Confluence data to generate more revenue with faster data decisions.