Get started free
Request a demo
Docs
Request a demo
Easily collect, blend any data from any of your business apps into your data warehouse, then enable those data in spreadsheets, BI tools & schedule AI Insights delivery to Chat tools or by email.
.png)


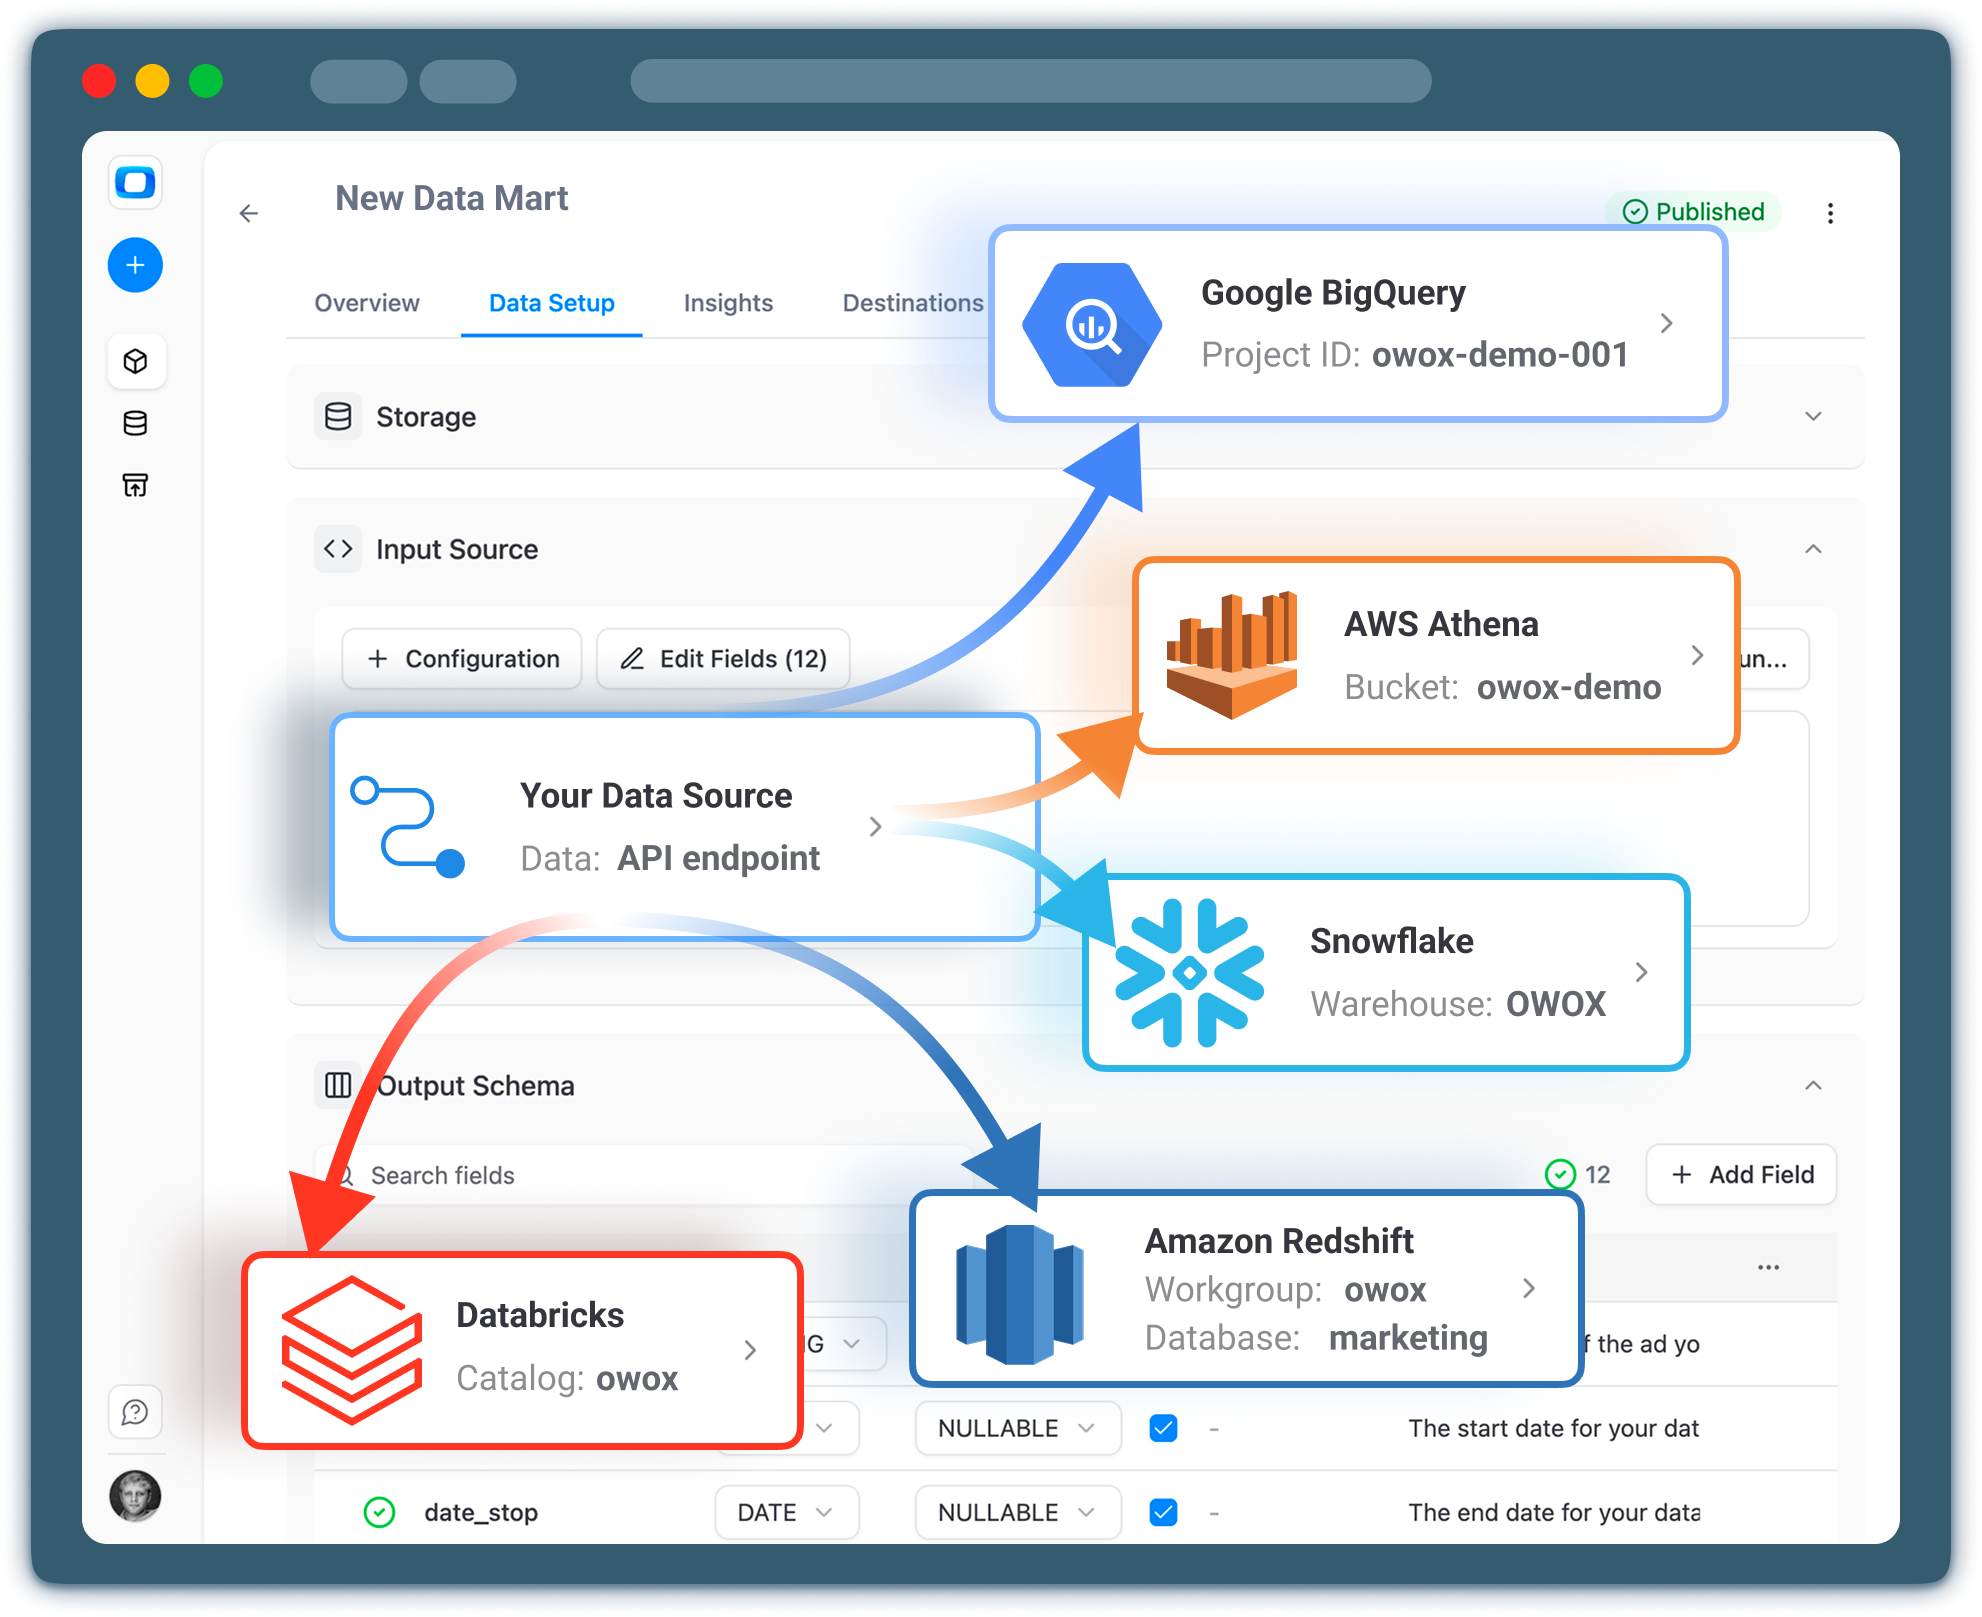
Decide where do you want your data to be stored - any data warehouse

Choose your app, give necessary permissions to account.

Select the fields your want to import. You can get the fields available in the API.

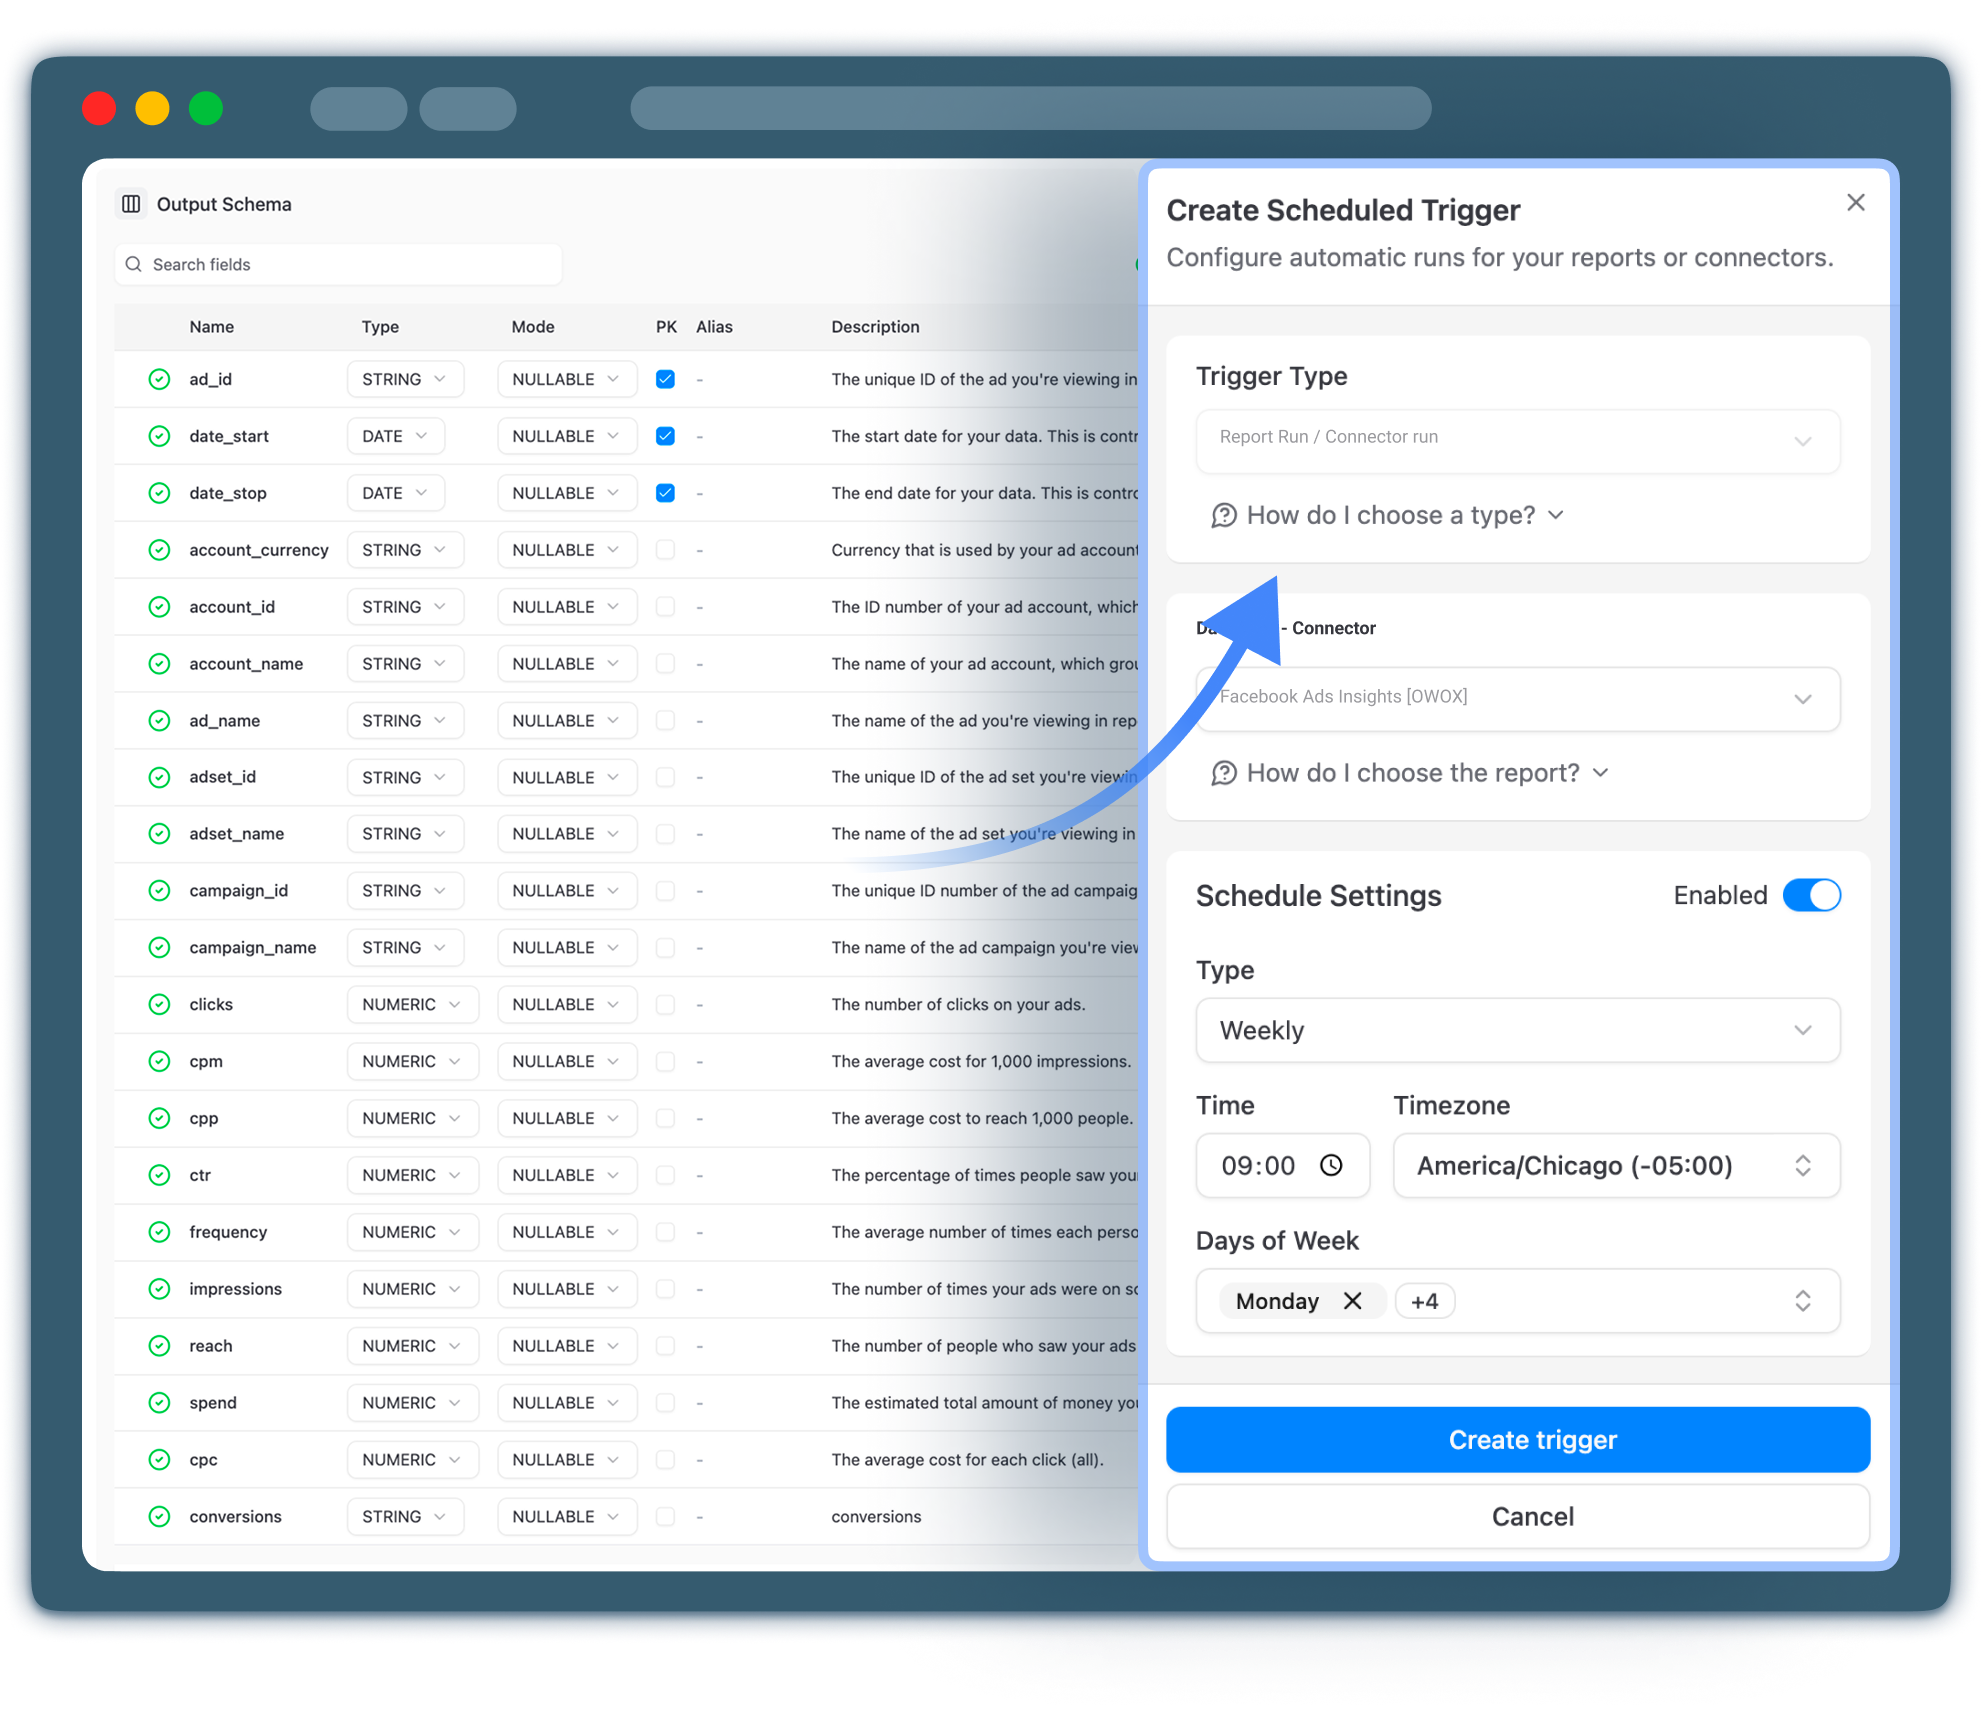
You're ready to go. Run connectors & set update frequency.

You don't want single-source reports, right? Collect more data!

Build a collection of data marts: SQL, tables, views or connectors.

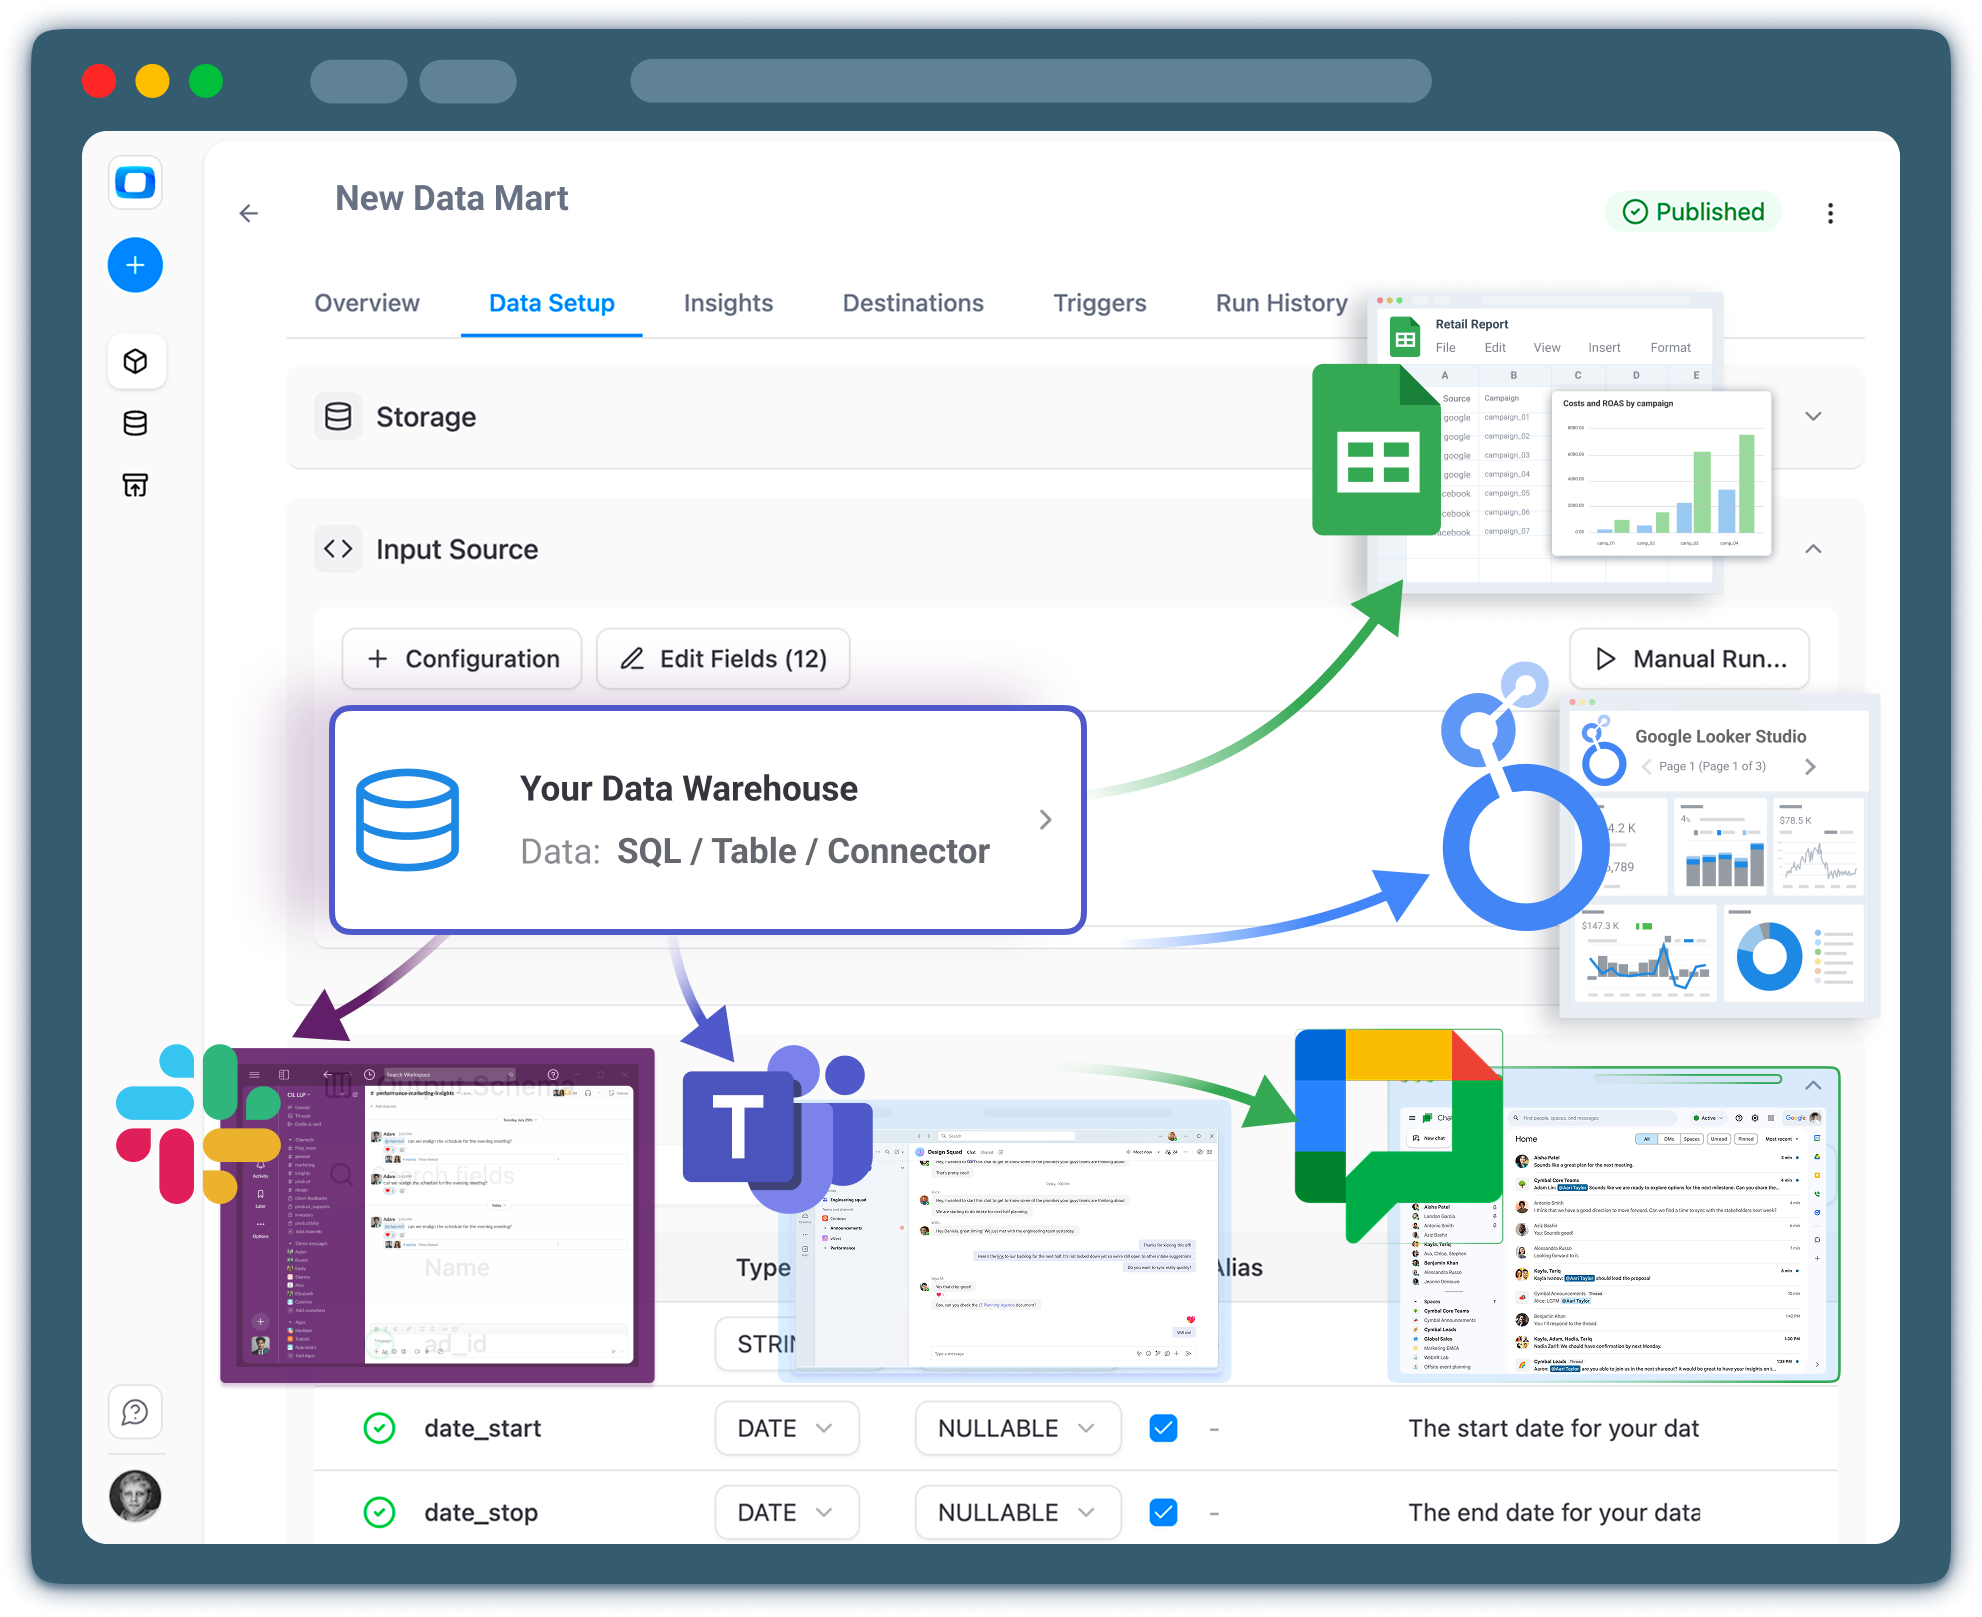
Select a data destination: Sheets, Looker Studio, Email or Chat tools.

Get focused on data insights, set delivery and forget about routine.

Companies rely on SaaS tools to move business data – but you can’t see what’s happening or make changes, and you're not in charge of a data engineer either.
Use OWOX Data Sources to extract data from any ads platform, CRM, database or any platform with API – with transparent logic, full visibility, credentials stored on your side and zero vendor lock-in.
Whether it’s Facebook Ads, or your LinkedIn Pages you decide what’s exactly pulled, how, and when.
You don't want to just collect data, right? You want to use it for reporting.
OWOX Data Marts lets you build a collection of Data Marts from SQLs, tables, views and connectors and enable that data on a schedule in various BI Tools & spreadsheets.
Plus you can use AI Insights to analyze data on a schedule with your prompts and deliver results to stakeholders exactly into corporate messengers like Slack or Teams, or simply by email.
With other SaaS tools you pay per data source, connector or per row. And when you scale - its painful.
Use OWOX Data Marts connectors to plug your data into any of the warehouses, starting at as little as 40¢ per connector per month, so you can connect as many platforms, tables or APIs as needed.
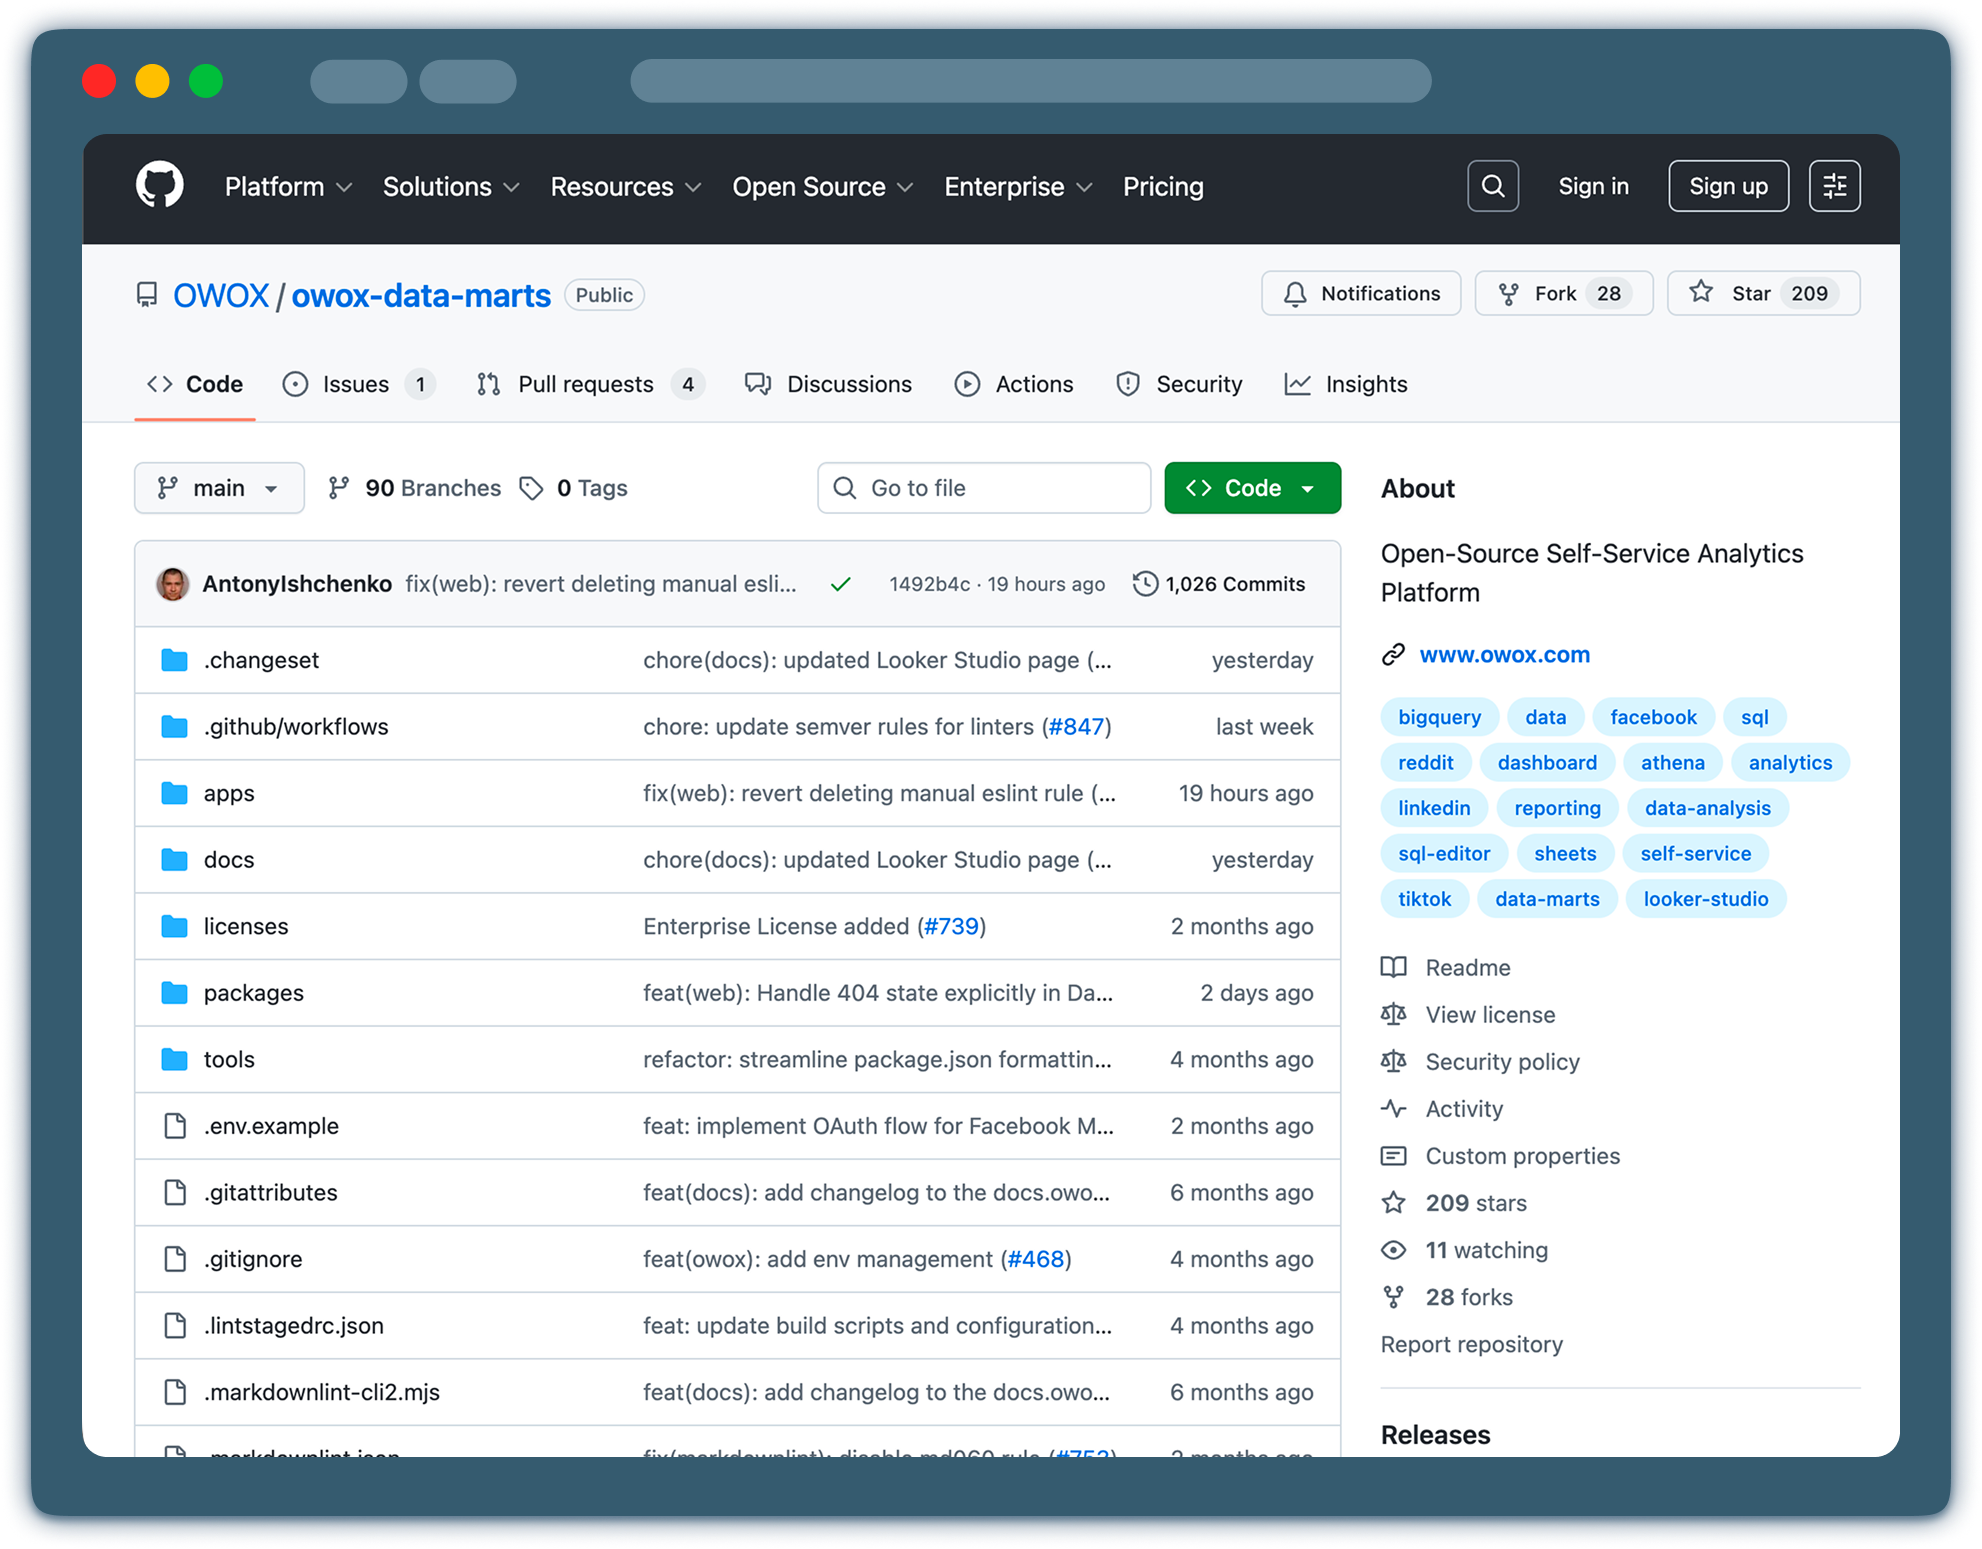
Note: You can even use it completely free forever with our community self-managed edition available on OWOX GitHub.
Most tools are built for advertising and GA4 – but you need CRM, accounting, and backend data too.
And we get it.
We already have Shopify, Open Exchange Rates, & GitHub connectors. Plus, our team + our amazing open-source community is working on adding more platforms support every day so you may expect to see new connectors coming live every month of 2026.
You can even contribute to our code and build a connector you need faster with our tooling.