PPC Reporting Made Simple: Metrics, Tools, and Strategies That Drive Results
Successful PPC campaigns rely on more than just ad clicks, they require accurate reporting to track performance, optimize budgets, and improve ROI. Without proper insights, businesses risk wasting money on ads that don't convert or failing to capitalize on what's working.
However, PPC reporting can be complex, with data spread across multiple platforms like Google Ads, Facebook Ads, and LinkedIn Ads. Understanding key metrics, setting up automated reports, and analyzing trends are essential to making data-driven decisions that enhance campaign performance.
Understanding PPC Reporting

These reports contain key metrics like return on ad spend (ROAS), revenue, Customer Lifetime Value (LTV), cost per acquisition (CPA), and cost per lead (CPL) for your paid campaigns. PPC reports help evaluate and optimize ads campaigns across various platforms like Google, Facebook, Instagram, and Bing. You'll need multi-channel reports for cross-channel budget allocation, as well as channel-specific reports that provide deeper insights, helping you understand the effectiveness of your advertising and marketing efforts, so you can improve your paid marketing strategy.
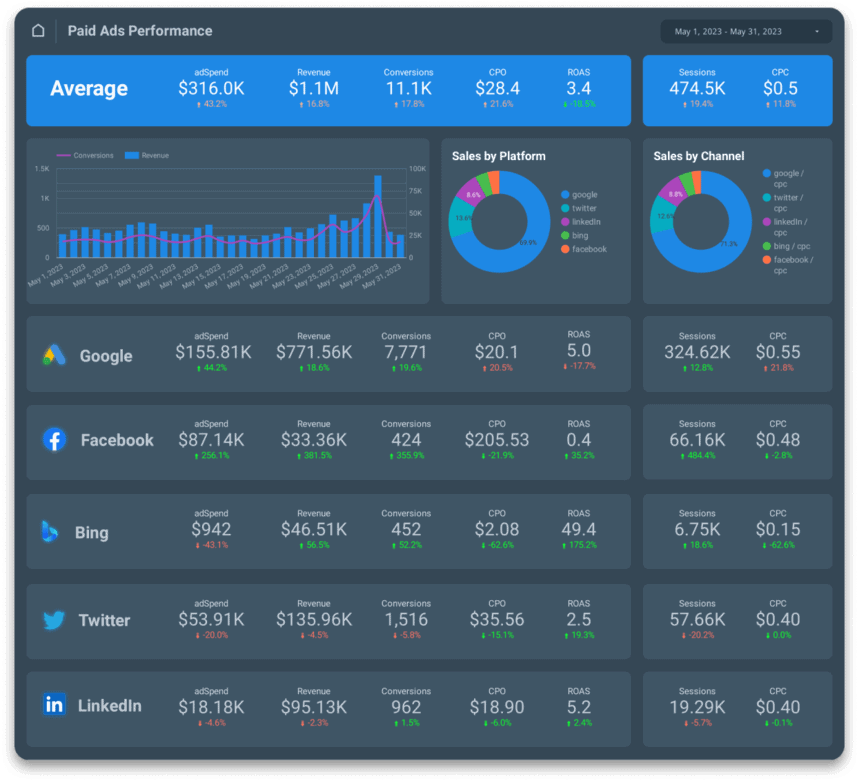
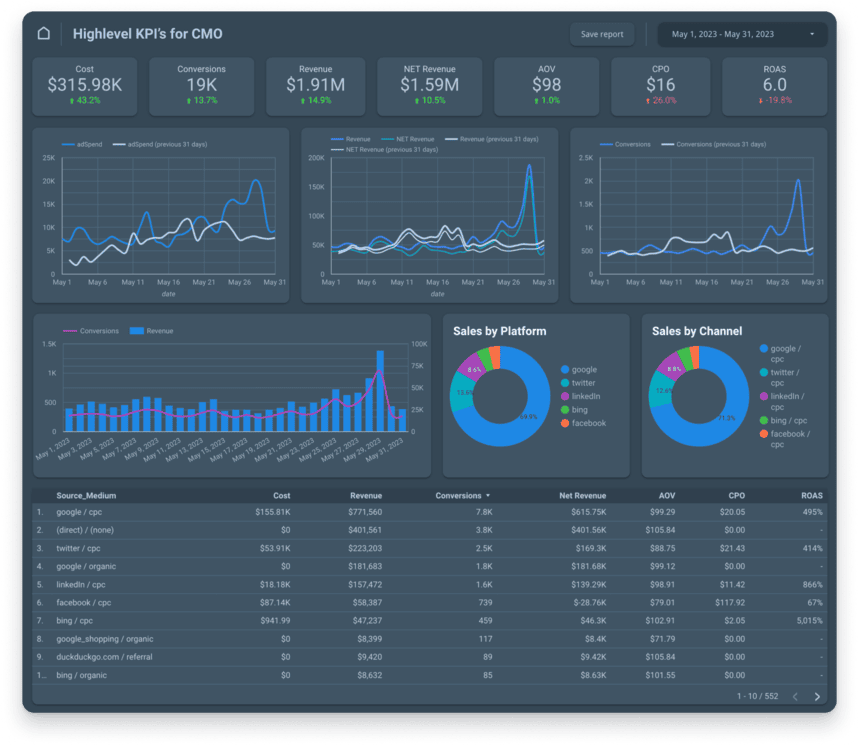
For example, you might find that Google Ads is driving higher revenue and has a better return on ad spend compared to Facebook and Instagram Ads. With this information, you can allocate more budget to Google Ads to maximize your ROAS and improve your overall paid marketing strategy.
Paid ads can bring in new customers, but with different target audiences at various stages, interpreting PPC reports may seem overwhelming. In this article, we'll walk you through the steps to gather the right data and create detailed reports that help you make better decisions. Let's dive in and make your PPC game stronger.
Key Metrics in PPC Reporting
When reporting your PPC advertising results, stakeholders, clients, or senior management will ask you:
- How much did you spend from the marketing budget?
- How many conversions did you get this month?
- What was NET Revenue in June?
- What was the blended customer acquisition cost?
- How well are these campaigns doing, and how can we make them better?
To answer these questions, you should have a strong understanding of your key PPC metrics.
Let's see on which of them you should focus:
Return on ad spend (ROAS) measures the revenue generated for every dollar spent on ads, indicating campaign profitability.

Return on investment (ROI) evaluates the overall profitability of your ad campaigns, considering all costs and revenue.

Conversion rate - the percentage of users who complete the desired action, like making a purchase or signing up.

Click-through rate (CTR) shows the percentage of users who clicked on your ad after seeing it.

Cost per click (CPC) calculates the average cost of each click on your ad.

Cost per conversion measures the average cost for each desired action, like a purchase or form submission.

CPA (cost per action) calculates the average cost for each desired action, similar to Cost per conversion.

CPM (Cost per mille) represents the cost for 1,000 ad impressions, irrespective of clicks or conversions.

PPC advertising is crucial, but without proper reporting, your ad spend could be wasted. With PPC reporting, you can track campaign performance, compare it to industry benchmarks or to average, and find the right audience that is ready to go all in with you. It also helps you optimize your offerings and figure out which channels work better at each stage of the sales funnel.
Strategies to Manage PPC Reporting
Effective PPC reporting requires a structured approach to track performance, optimize spending, and improve ad efficiency. Let's look at some approaches to manage PPC reporting.
Comparing Date-to-Date
To effectively manage PPC advertising campaigns across multiple platforms like Google Ads campaigns, Facebook Ads, and Microsoft Ads (formerly Bing Ads), track and compare results over time and across multiple channels. With PPC reporting, you can study how your campaigns have performed on different dates, spotting trends and patterns. This helps you adjust your strategies to suit the changing environment.
Budget Optimization
With PPC data, you will definitely manage your budget better. For example, the report would show which keywords help your ad convert better, so you can spend more on it to get better results, as well as which platforms help you reach your target audience. This will help you avoid irrelevant placements and allocate your budget effectively.
Improving ROI
If you improve targeting and get rid of things that aren't doing well, your ad will be more spot-on for the right people. That means more potential buyers will click on it and take the desired action, giving you a higher ROI.
Getting a Complete Overview of your KPIs
With reports and Google Analytics, you can access key metrics like CTR, Conversion rate, and CPA/CPO in one place, making it easier to understand your ad performance. This clarity allows you to analyze data faster, leading to better results for your campaigns.

Data Visualization Tools for PPC Reporting
Data visualization tools are software that help convert original data into visually appealing and meaningful representations. These tools can integrate with platforms like Microsoft Ads, making them valuable for data analysis as they provide a visual context that makes it easier to understand patterns, trends, and relationships within the data.
Looker Studio
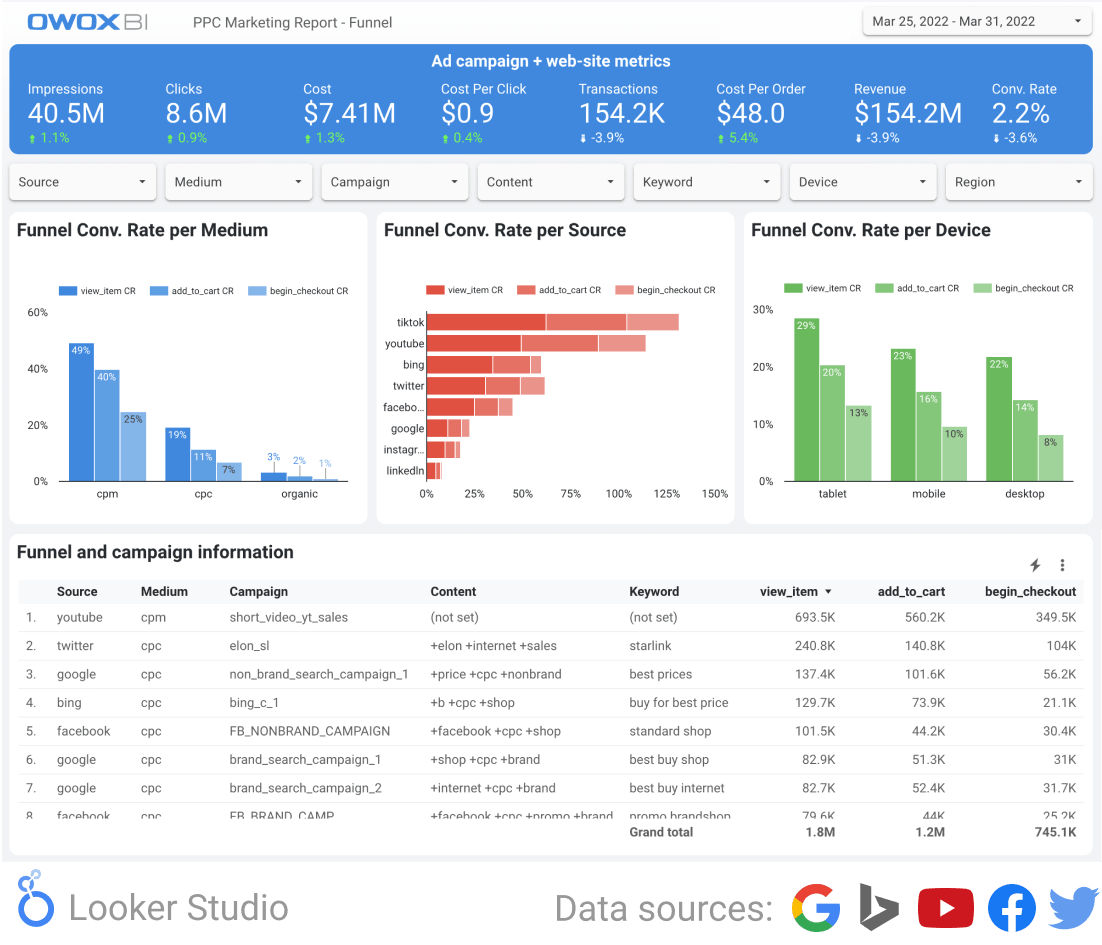
Google Looker Studio (formerly Data Studio) is a data visualization tool that syncs multiple data sources into one reporting experience. It allows users to create informative and visually appealing dashboards that are easy to interpret, customize, and share. The free plan is available.
Power BI
Microsoft Power BI is a collection of online tools by Microsoft that helps you understand data better. It turns raw data into easy-to-understand visuals like charts and tables. Power BI includes different tools like apps, software services, and native connectors that let you create reports and dashboards.
Versatile tool by Microsoft enabling data shaping, transformation, and visualization before reporting, with integration with Excel and other Microsoft apps.
Tableau
Renowned for its visualization capabilities, this platform delivers beautiful, appealing reports. It is highly popular and user-friendly, with a large fan base in the public and enterprise sectors.
Google Sheets
A cloud-based spreadsheet tool helps prepare and analyze data for reporting, accessible and collaborative from any device.
OWOX Data Marts
OWOX Data Marts collects your marketing raw data and transforms it into ready-to-use data marts in your warehouse, giving you full control over data collection, preparation, and reporting.
How to Build PPC Reports
Creating an effective PPC report involves a refined PPC reporting process that goes beyond presenting data; it's about finding information that bridges the gap between campaign metrics and business goals.

These reports not only reveal high-performing keywords to capitalize on, but also offer optimization opportunities for future campaigns and even SEO strategies.
Here is the list of 8 steps that will help you craft impactful PPC reports:
Choose a PPC Reporting Tool
When you're picking PPC reporting tools, take a moment to think about a few things. Look for ones that are easy to use, show data in a way you can understand, and work well with the platforms you use, like Google Ads or Facebook Ads.
It's great to find a tool that lets you customize the list of metrics & dimensions for reports, updates data with the frequency you need, and even more importantly - blends the data from different sources so you don't swap the dashboards to compare results.
Don't forget to check if it integrates with your on-site analytics and, of course, make sure it fits your budget and has good customer support. In the end, go for a tool that meets your needs and helps you keep an eye on your advertising performance, so you can make improvements along the way.
Set Clear Goals
Think about what you really want to accomplish with your ads.
Do you want more people to visit your website? Or maybe you're after more leads or sales.
Be clear about your objectives and make sure they're achievable. Set a timeframe to reach these targets so you can track your progress. Also, make sure your goals match your overall business goals to keep everything in sync.
Don't forget to review and adjust your goals regularly based on the data from your PPC reports. This way, you can stay on top of things and make your campaigns even better.
Choose the Right Metrics & Dimensions
In advertising, there are many different goals like selling more, making people know about a brand, getting new customers, bringing more visitors to a website, improving retention, etc. Choosing the right metrics is essential for a successful PPC strategy.
To measure how well these goals are met, use KPIs like conversion rate, click-through rate, and customer retention rate, among others. Tracking these KPIs is important to see how successful the ads are and to make better choices for future ad campaigns.
Analyze Data
The first step is to gather and summarize all the information from your campaigns. Take a closer look at important metrics to spot any patterns or trends. Compare data over different periods, like weekly or monthly, to see how your campaigns are evolving.
Then, find out what's working well and what needs improvement. For example, by regularly reviewing and analyzing the data, you can fine-tune your ad copies based on the messaging that resonates most with your target audience. With these insights, you can improve your ad content, targeting, and budget allocation.
Present Information Visually
When you're presenting data visually for PPC reporting, precision is key. Don't make differences look bigger or smaller than they really are. Play around with different graph types to find the best one for your data.
Look at PPC reporting examples online, or see how other parts of your business display data visually to get ideas. Remember, the goal is to provide a clear and honest representation of the information.
Provide Context
When you're looking at performance metrics trends in PPC reporting, provide context for better readability.
Let's say your CTR suddenly drops a lot in the last month. Without context, it might seem alarming. But when you dig deeper, you find out that a competitor launched a campaign during that time, and it affected how people behaved. So, it's not because your ads are bad, it's just external factors. With this context, you can't adjust your strategies.
Be Consistent
When you keep a consistent format, it brings a sense of order and professionalism to your reports, your stakeholders can easily understand the data, and it becomes a familiar sight for them. Plus, weekly or monthly reporting keeps everyone in the loop and ready to make timely decisions based on the information.
Compare comparable (e.g., transform all of the data to the same currency), name the metrics the same, and use the same data format (e.g., use the same number of signs after comma). So, stick to the same format and reap the benefits.
Include Recommendations
The recommendations in PPC reporting should offer actionable advice based on the data you present. For instance, if CTR is low, the recommendation might suggest optimizing ad headlines and descriptions to improve engagement. If the cost per click (CPC) is high, you could propose adjusting bids or refining keyword targeting.
Interpreting PPC Reports
Understanding PPC reports requires critical thinking to extract valuable insights crucial for optimizing your PPC campaign. Let's explore specific actions to succeed in optimizing your advertising strategies effectively.
Identify Trends
Spotting trends in PPC reporting is incredibly important as it provides a deeper understanding of performance fluctuations. For instance, while conversions may show a monthly decrease, zooming out to the YTD (year-to-date) view reveals significant growth.
Recognizing the seasonal patterns and the boost in conversions for a particular month should raise important questions. Therefore, you need to explore the factors driving this increase and assess how budgets and acquisition costs compare year over year.
Spot Areas for Improvement
You don't have to compare the metrics with another period, you should also focus on comparing the underperforming metrics to your goals. For example, if some metrics are lower than expected, you may need to refine ad copy or targeting, optimize landing pages, etc.
Using a PPC report template can help spot areas for improvement by organizing complex data and customizing reports to meet specific client needs.
Make Data-Driven Decisions
After analyzing metrics, identifying trends of campaign performance, and other key data in the PPC report, you can set your goals. Use the insights achieved to develop data-driven strategies, such as improving ad content or optimizing targeting, and align these strategies with your business objectives.
Advanced PPC Reporting
Apart from the standard steps, you can elevate your reports with advanced techniques like incorporating A/B testing, segmentation, and automated reporting into a PPC reporting template.
A/B Testing
To take your PPC reporting to the next level, consider presenting A/B testing results. Make sure to show different variations side by side, and dig down to the level of KPIs that were in your focus forthe specific testing phase.
To show any significant differences between variations, use charts and graphs, which will also help you explain the test objectives and the winning variation, so you can present ideas for future campaign optimization. Keep the visualization simple and really focused on only what matters the most to explain the impact of A/B testing on your PPC performance to stakeholders.
Segmentation
To show how well your campaigns are doing, segment your PPC report by intent or audience. For instance, if some campaigns aim for brand awareness instead of direct sales, focus on their unique goals, and not on the cost per acquisition.
Organize the report into stages and highlight each campaign's planned effect. This way, you can see how each campaign contributes to driving conversions and get a better overall view of your PPC performance.
Automate Reporting
Automated tools keep your data updated without any manual work, making it easy to collect the data you need, transform it to the required structure, prepare for reporting, and process it in the visualization tool to get actionable insights.
Remember, you'll need to blend the marketing data from various apps into a single data structure and set schedules for automated data operations.
For example, you can:
- Collect the data from various sources at 6 am every day,
- Blend the advertising data at 6.30 am,
- Collect events into sessions at 7 am,
- Finally, prepare your data for reporting at 7.30 am, ensuring your PPC reports are always ready by 8 am and reflect the latest information.
Building PPC Reports with OWOX Data Marts
OWOX Data Marts helps you collect and combine PPC data from all your advertising platforms into a single, reliable dataset in your data warehouse. Whether you're running campaigns across Google Ads, Facebook Ads, Microsoft Ads (formerly known as Bing Ads), or LinkedIn Ads, OWOX Data Marts brings all of that data together in a safe place like Google BigQuery — ready for reporting in any visualization tool you prefer.
Whether you're an agency handling multiple clients or a marketing leader managing cross-channel budgets, OWOX Data Marts gives you a clean, governed data layer that analysts can trust and business users can explore without writing SQL.
What you get with OWOX Data Marts for PPC reporting:
- All PPC data from multiple platforms combined in one place for easy comparison.
- Accurate insights blending ad platform data with website and CRM data, measuring actual customer purchases.
- Automated data collection and preparation — no manual exports or copy-pasting.
- Save time on data extraction, transformation, and report building.
- Built-in data quality checks to ensure accurate information.
- Full flexibility to build custom metrics and dimensions for your specific reporting needs.
- Monitor ad campaign effectiveness with data security and governance built in.
FAQ

%202.png)

.avif)