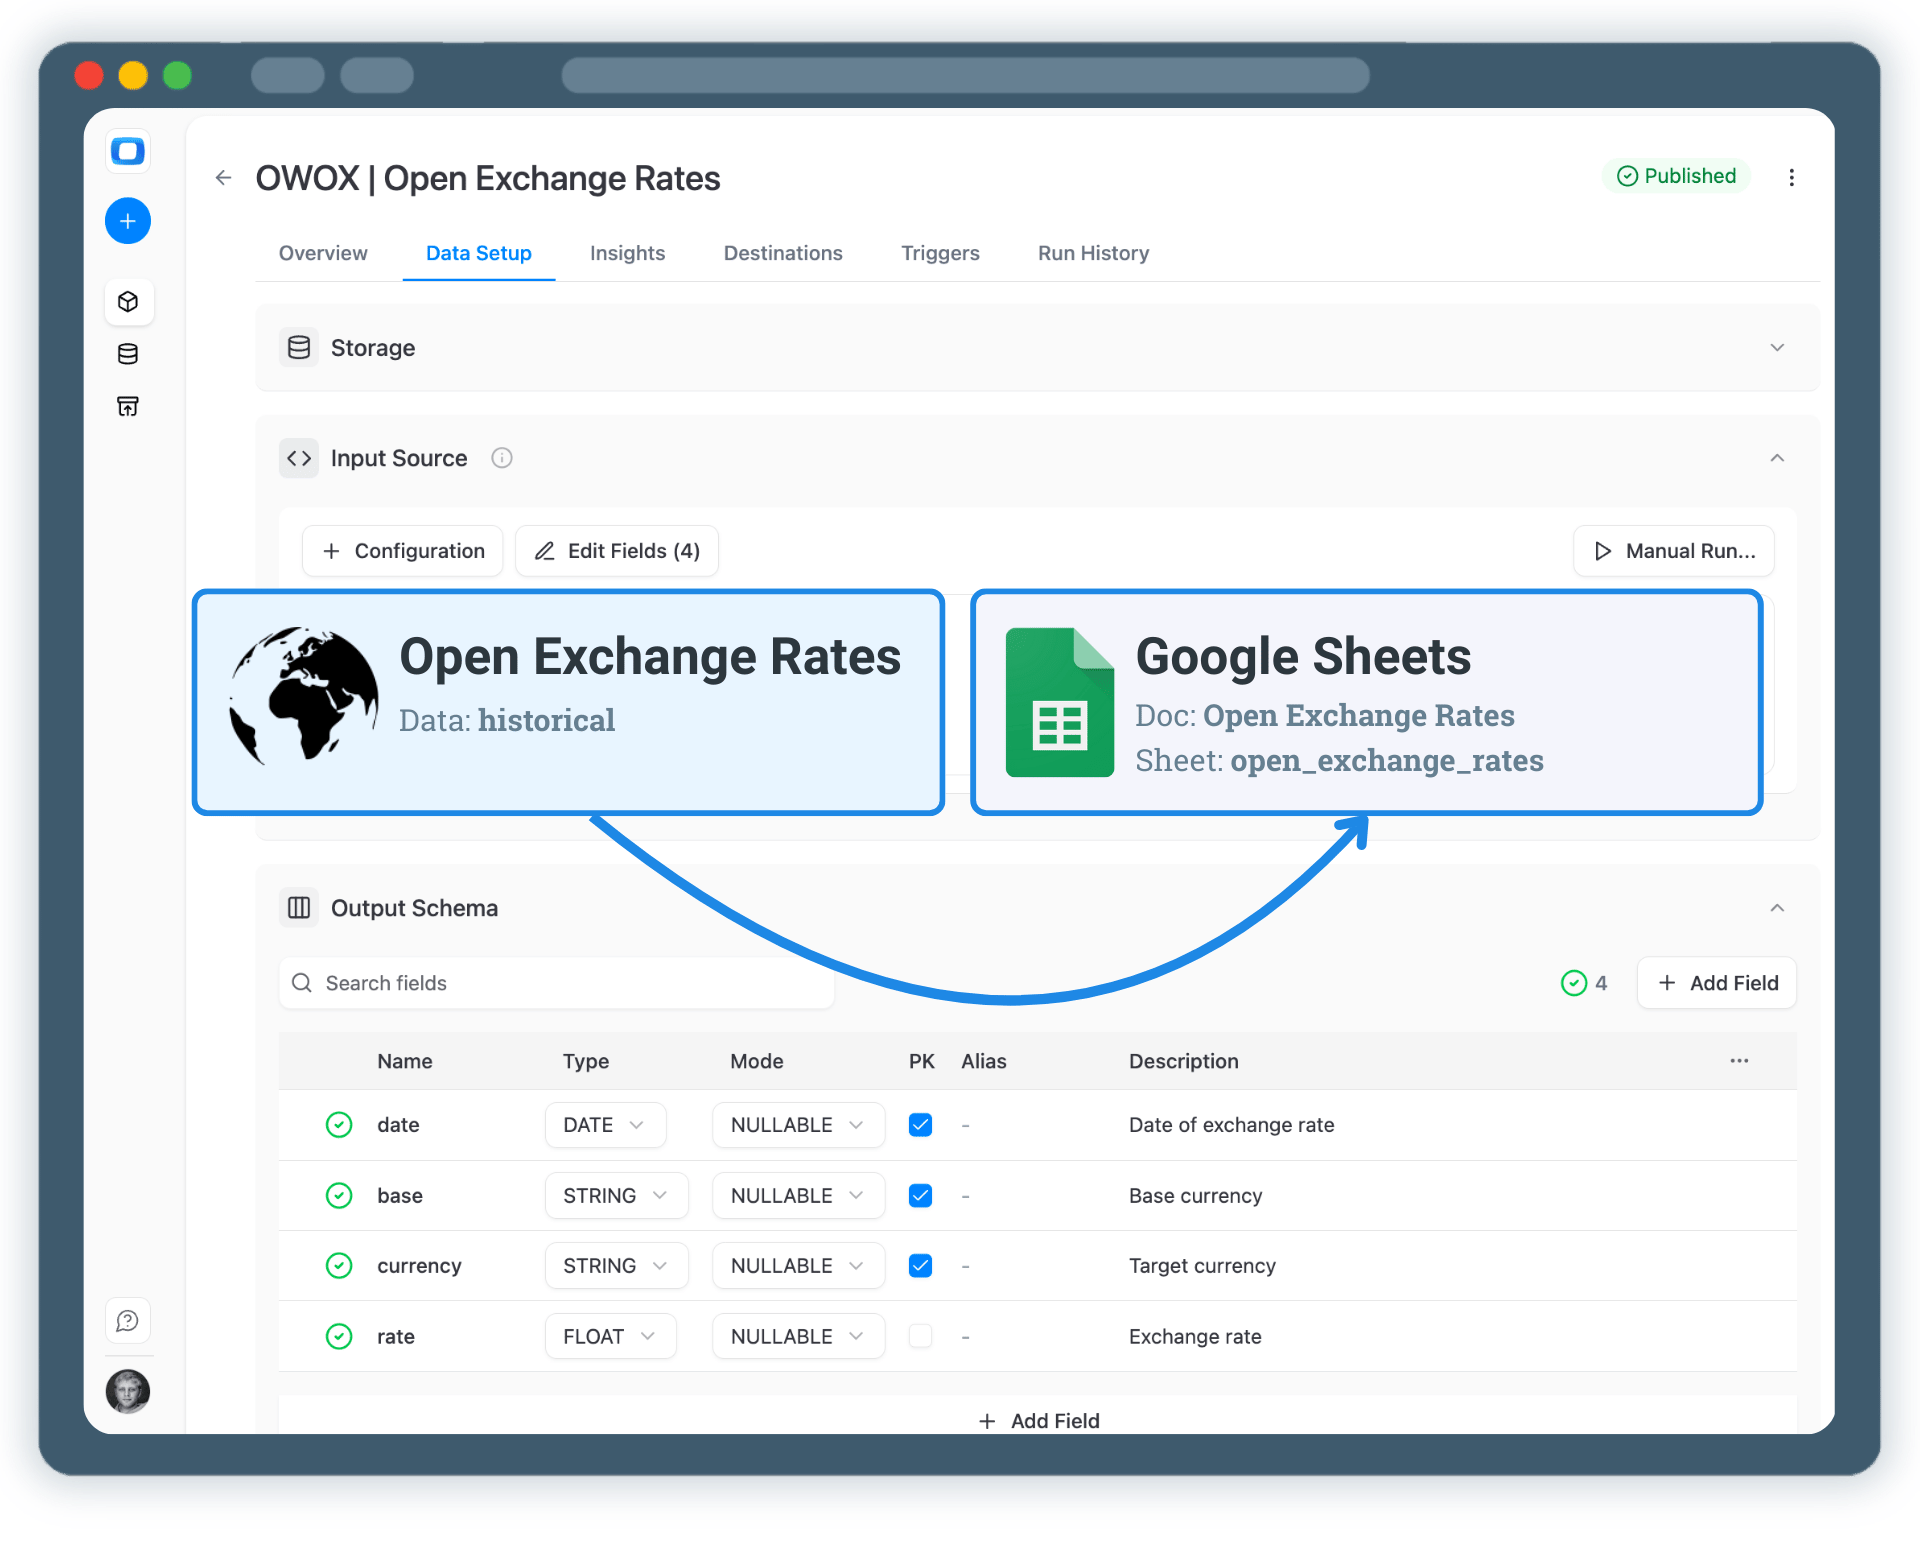
Connect Open Exchange Rates Data to Google Sheets
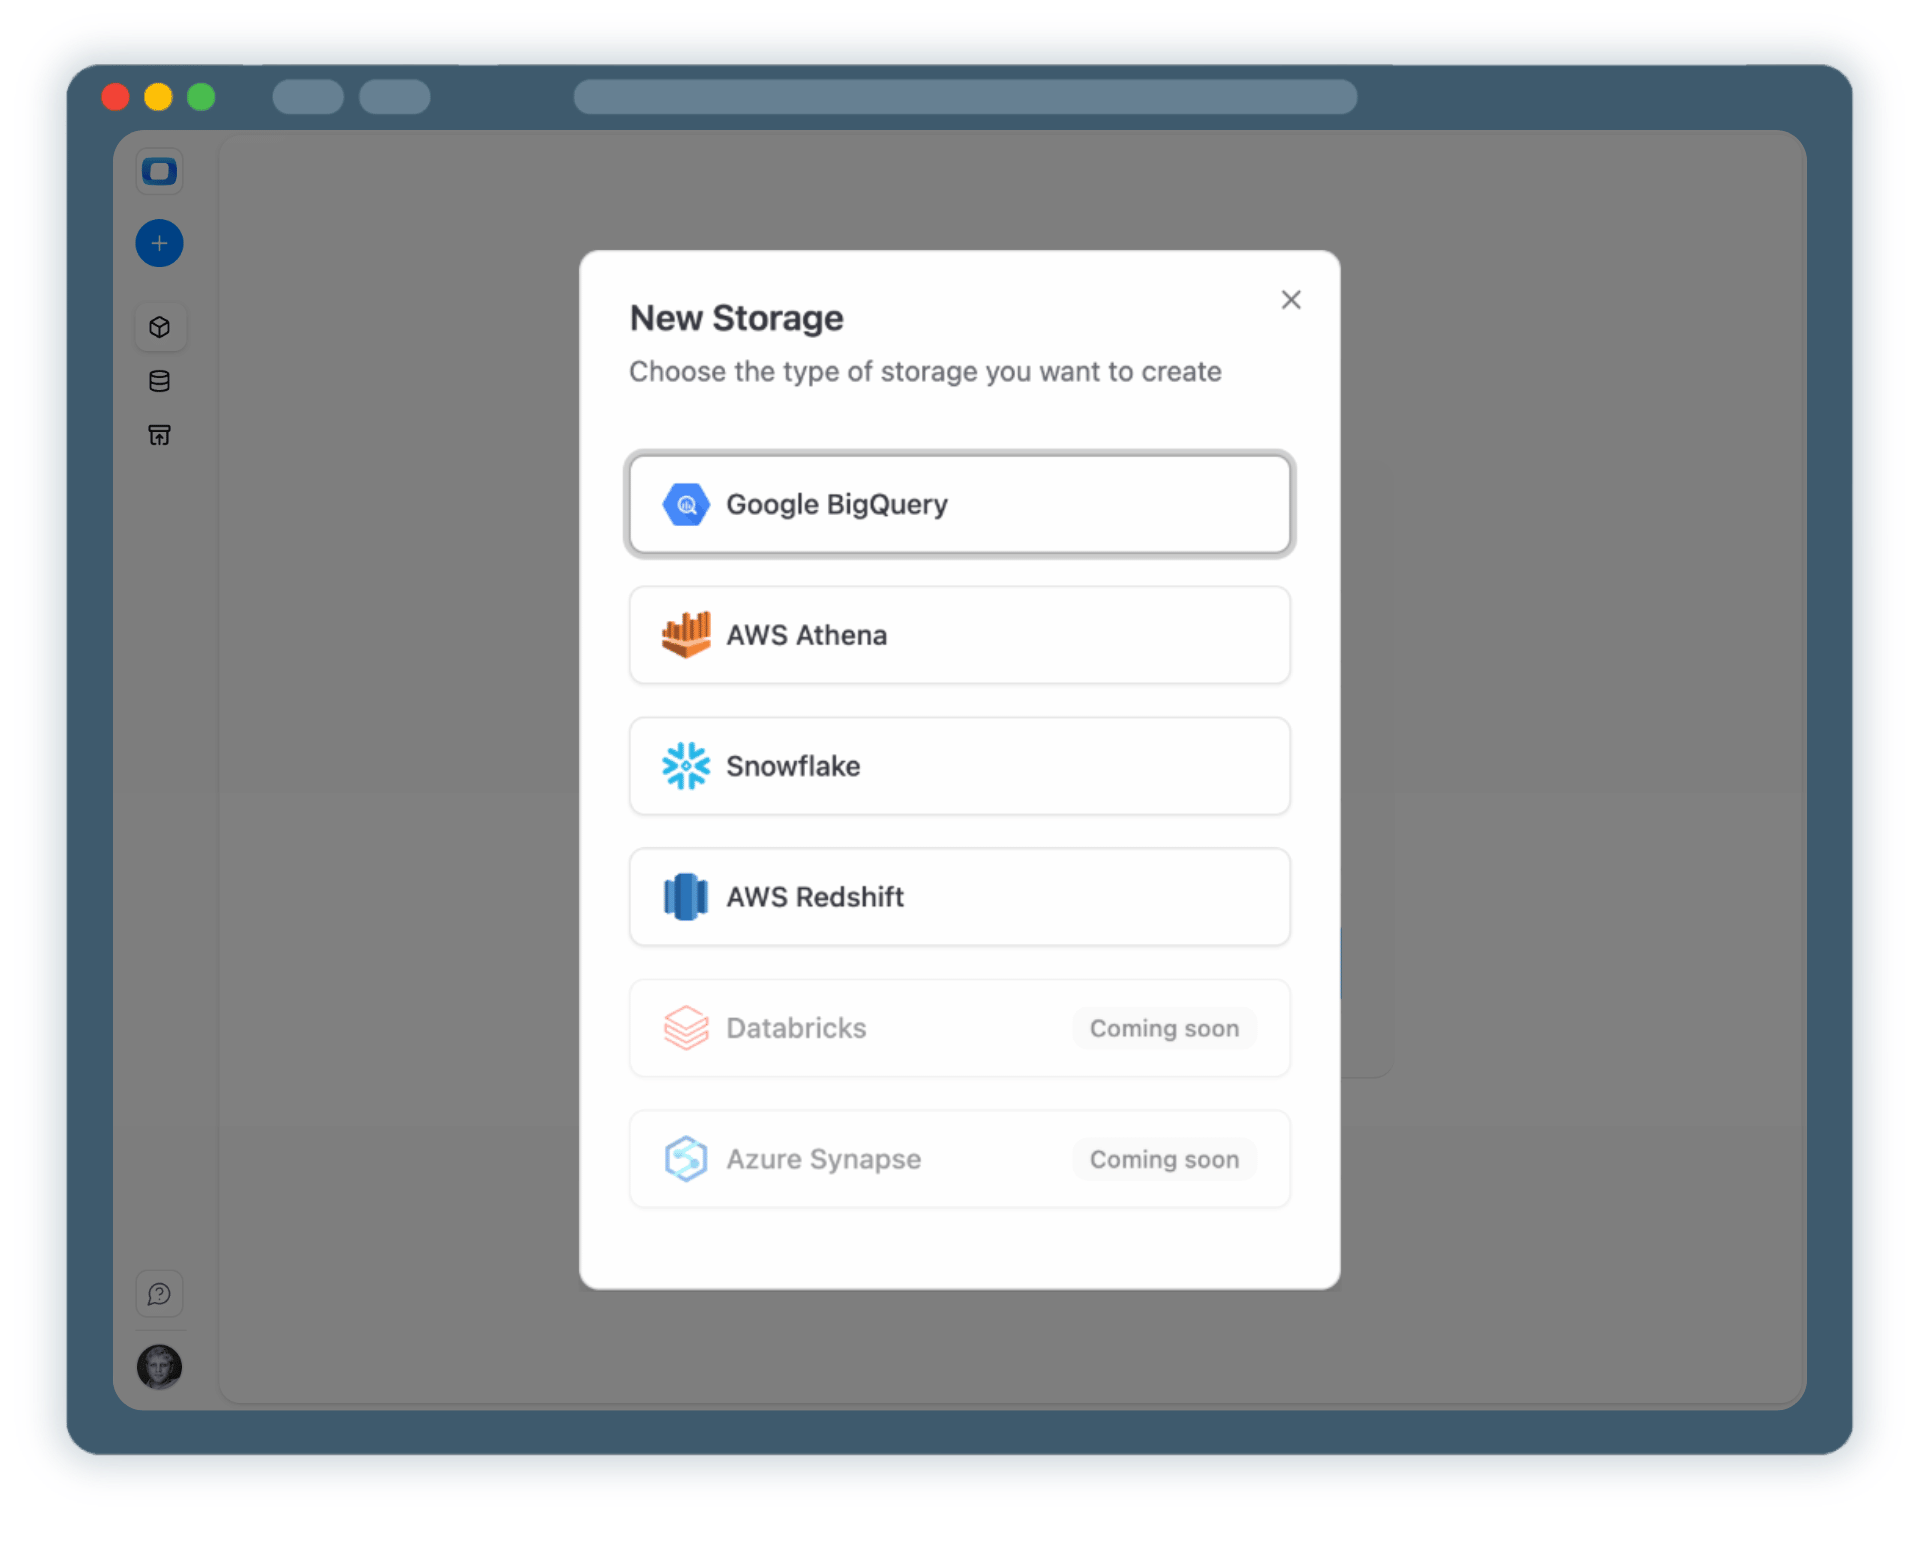
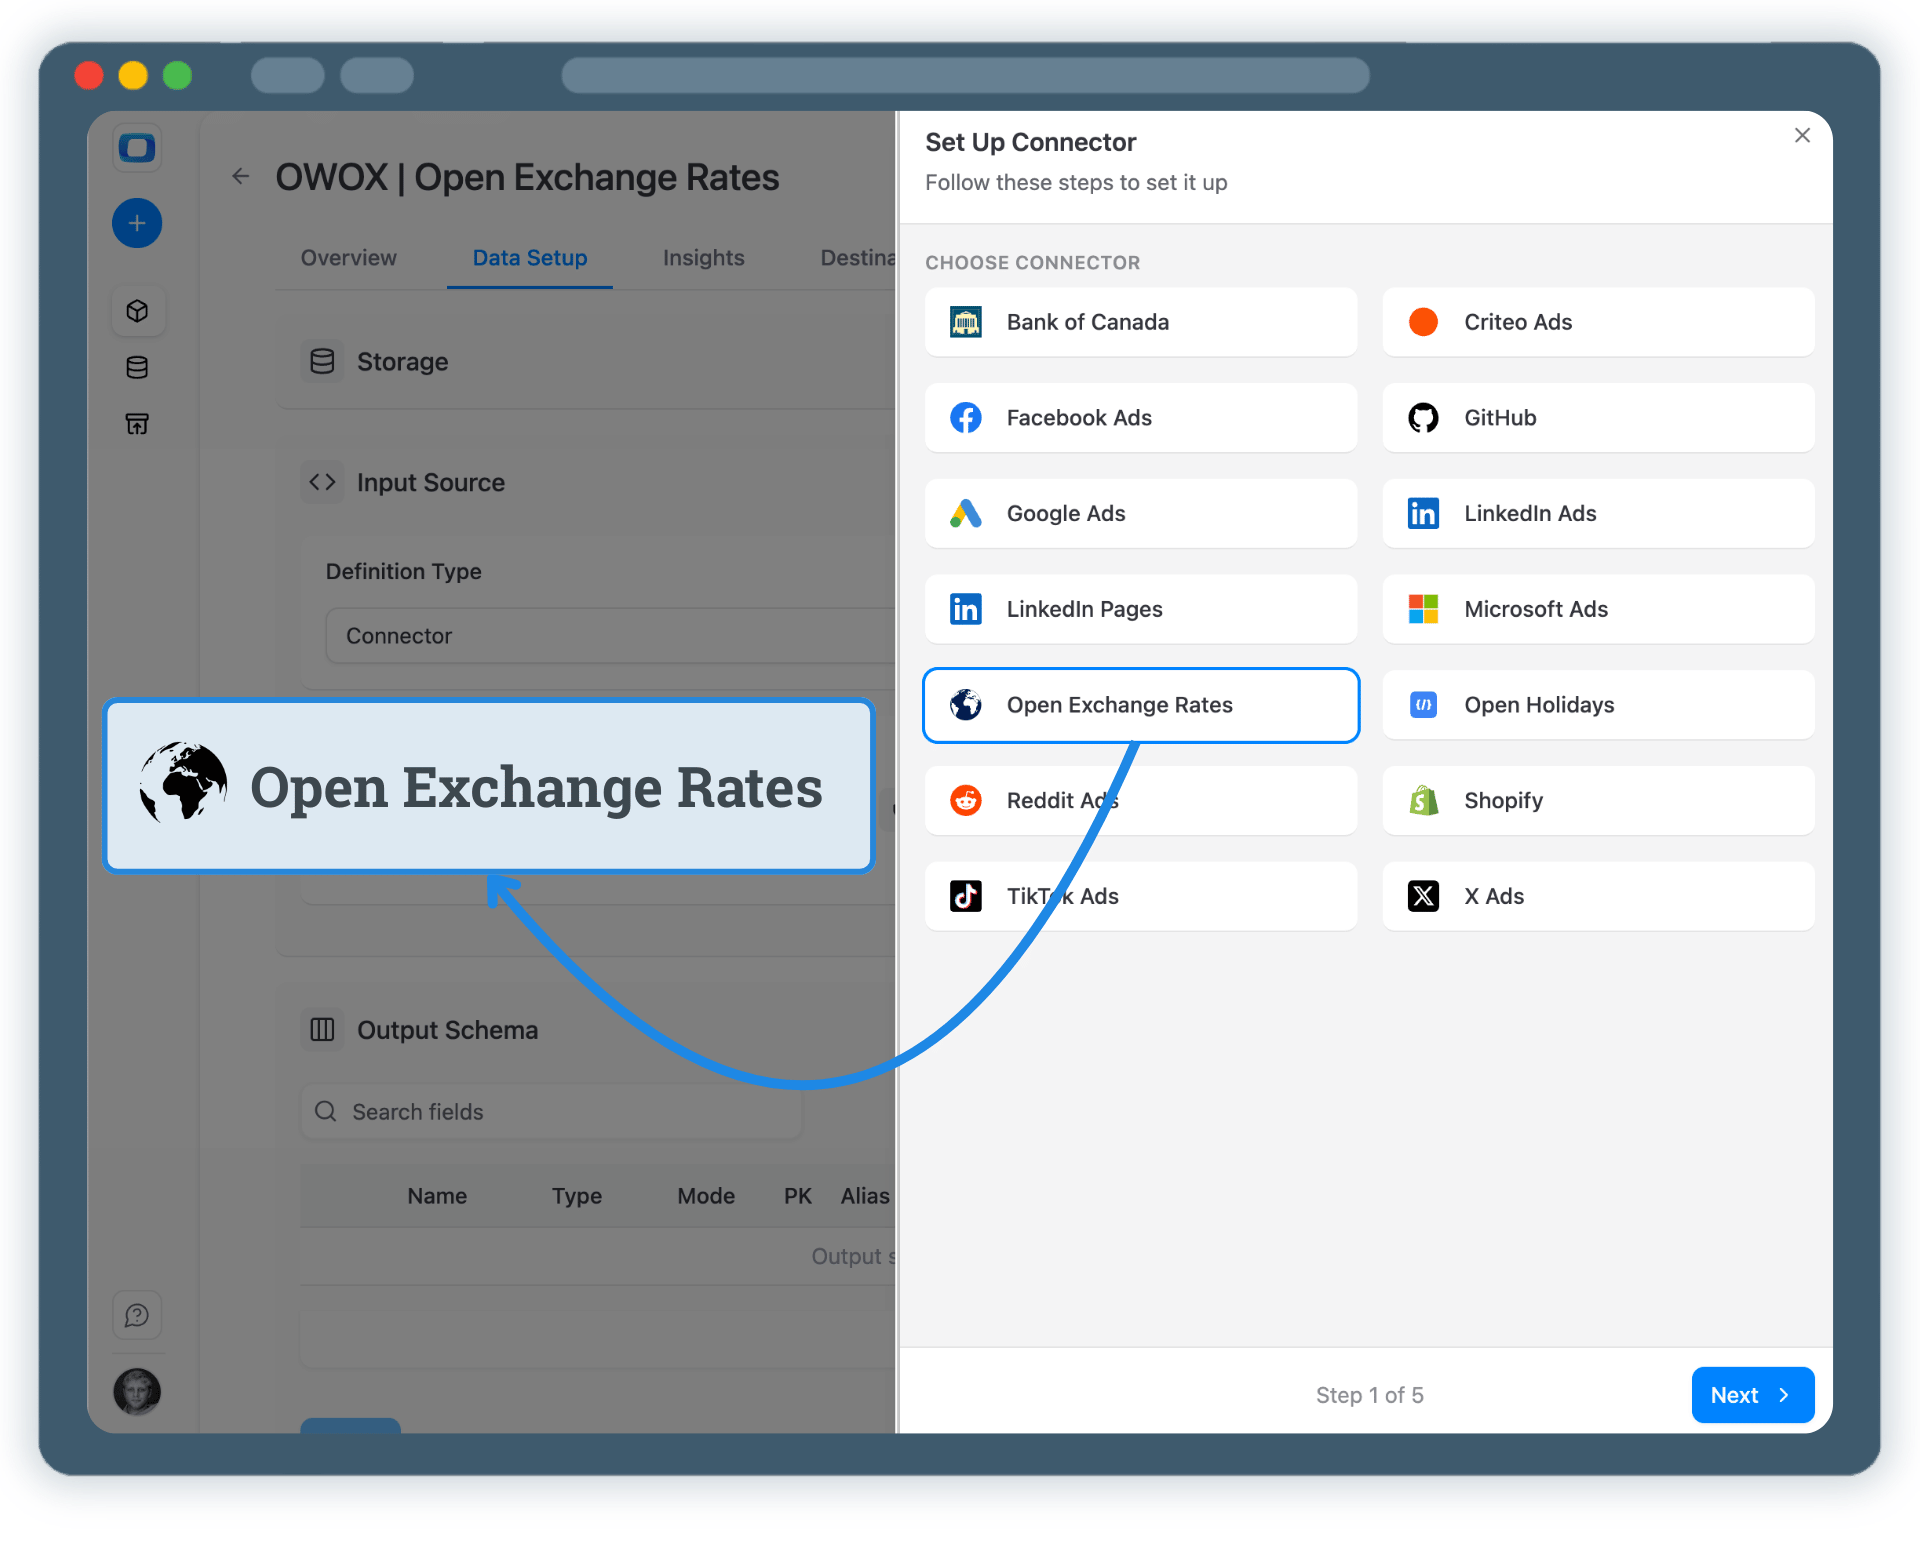
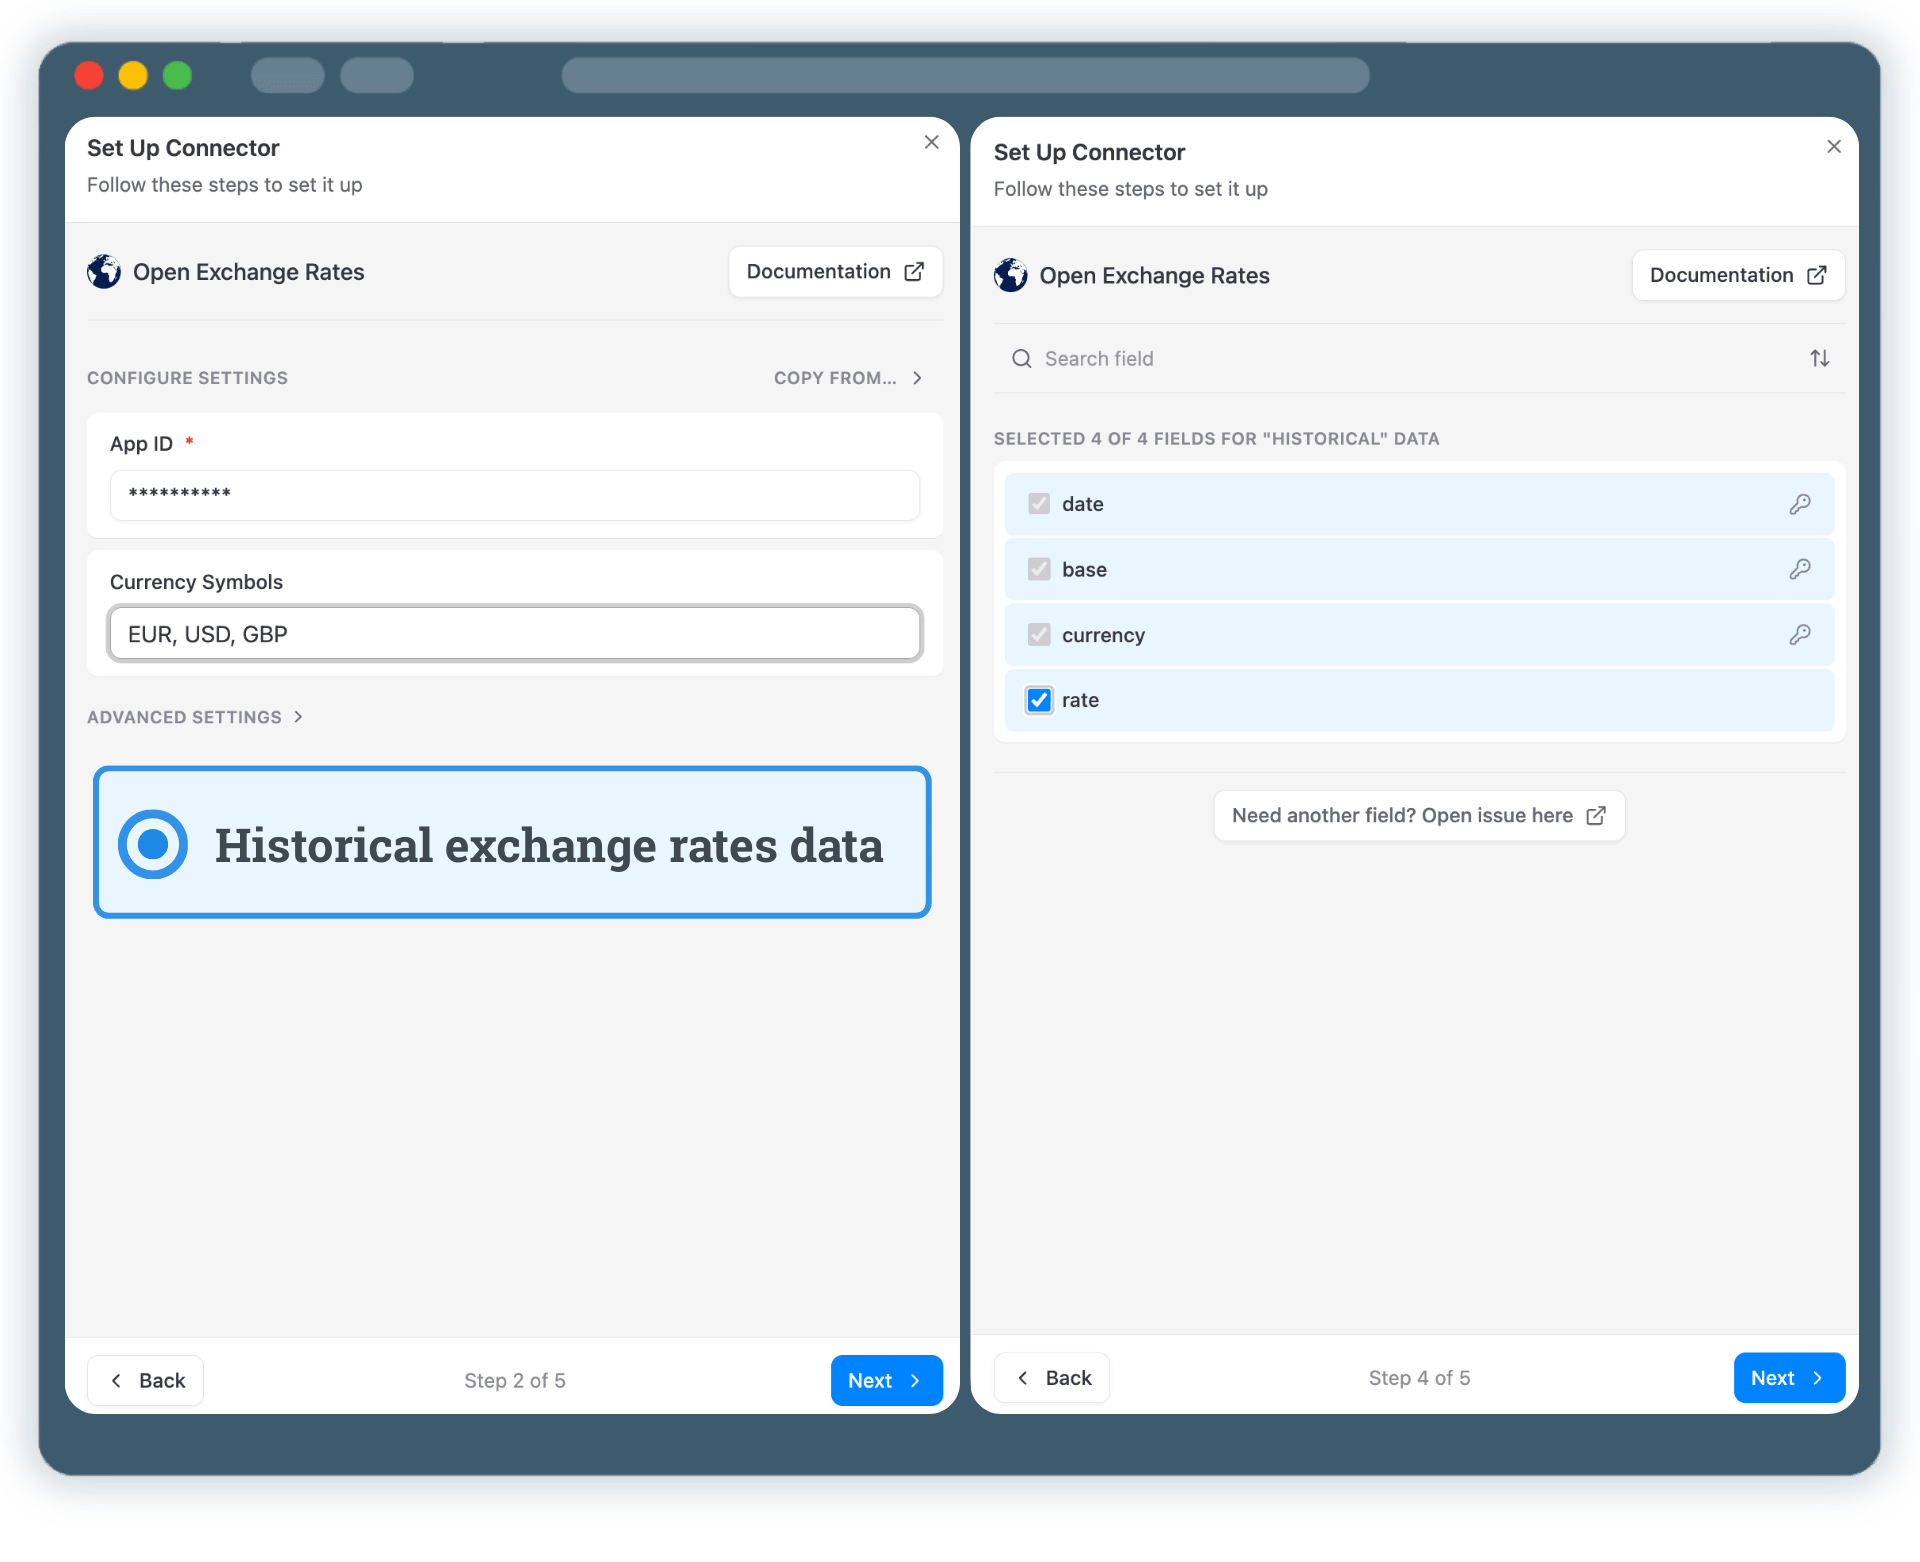
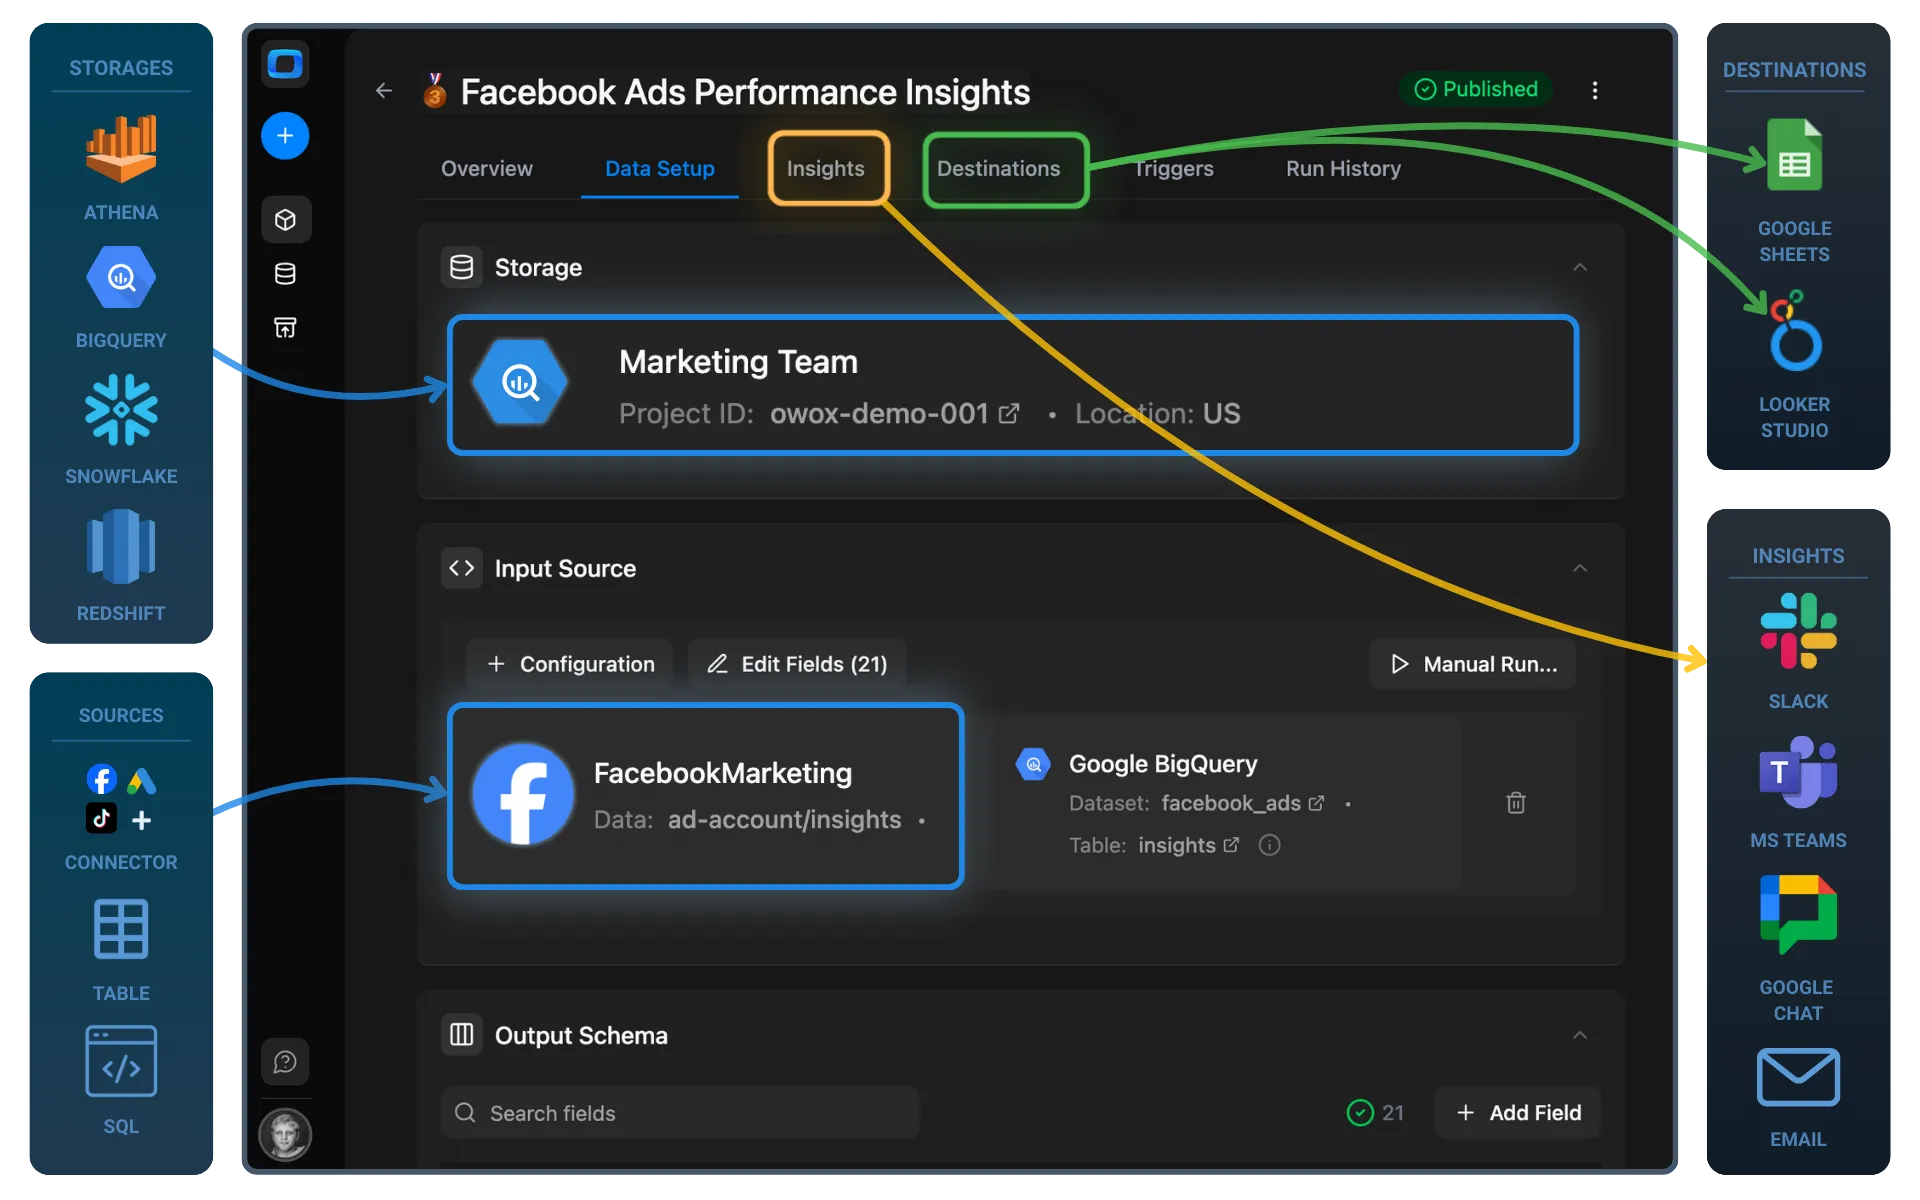
Use Google Sheets as a reporting destination for unified currencies of your monetary data with OWOX Data Marts. Collect Open Exchange Rates Data into any data warehouse, then blend with SQL & enable it in Sheets (or Looker Studio) for reporting. Or enable AI Insights and deliver ads performance & allerts into chat tools or by email.