OWOX gives your marketing team direct access to governed campaign data — attribution, spend vs. revenue, cross-channel performance — in Google Sheets. No analyst queue. No CSV exports. No conflicting numbers.


Every campaign launch generates a wave of data requests. Every board review needs fresh metrics. Your analysts are drowning in marketing tickets — and your team is still waiting.
Your marketing team shouldn’t need a ticket to see ROAS. And your analyst shouldn’t spend their career pulling it.
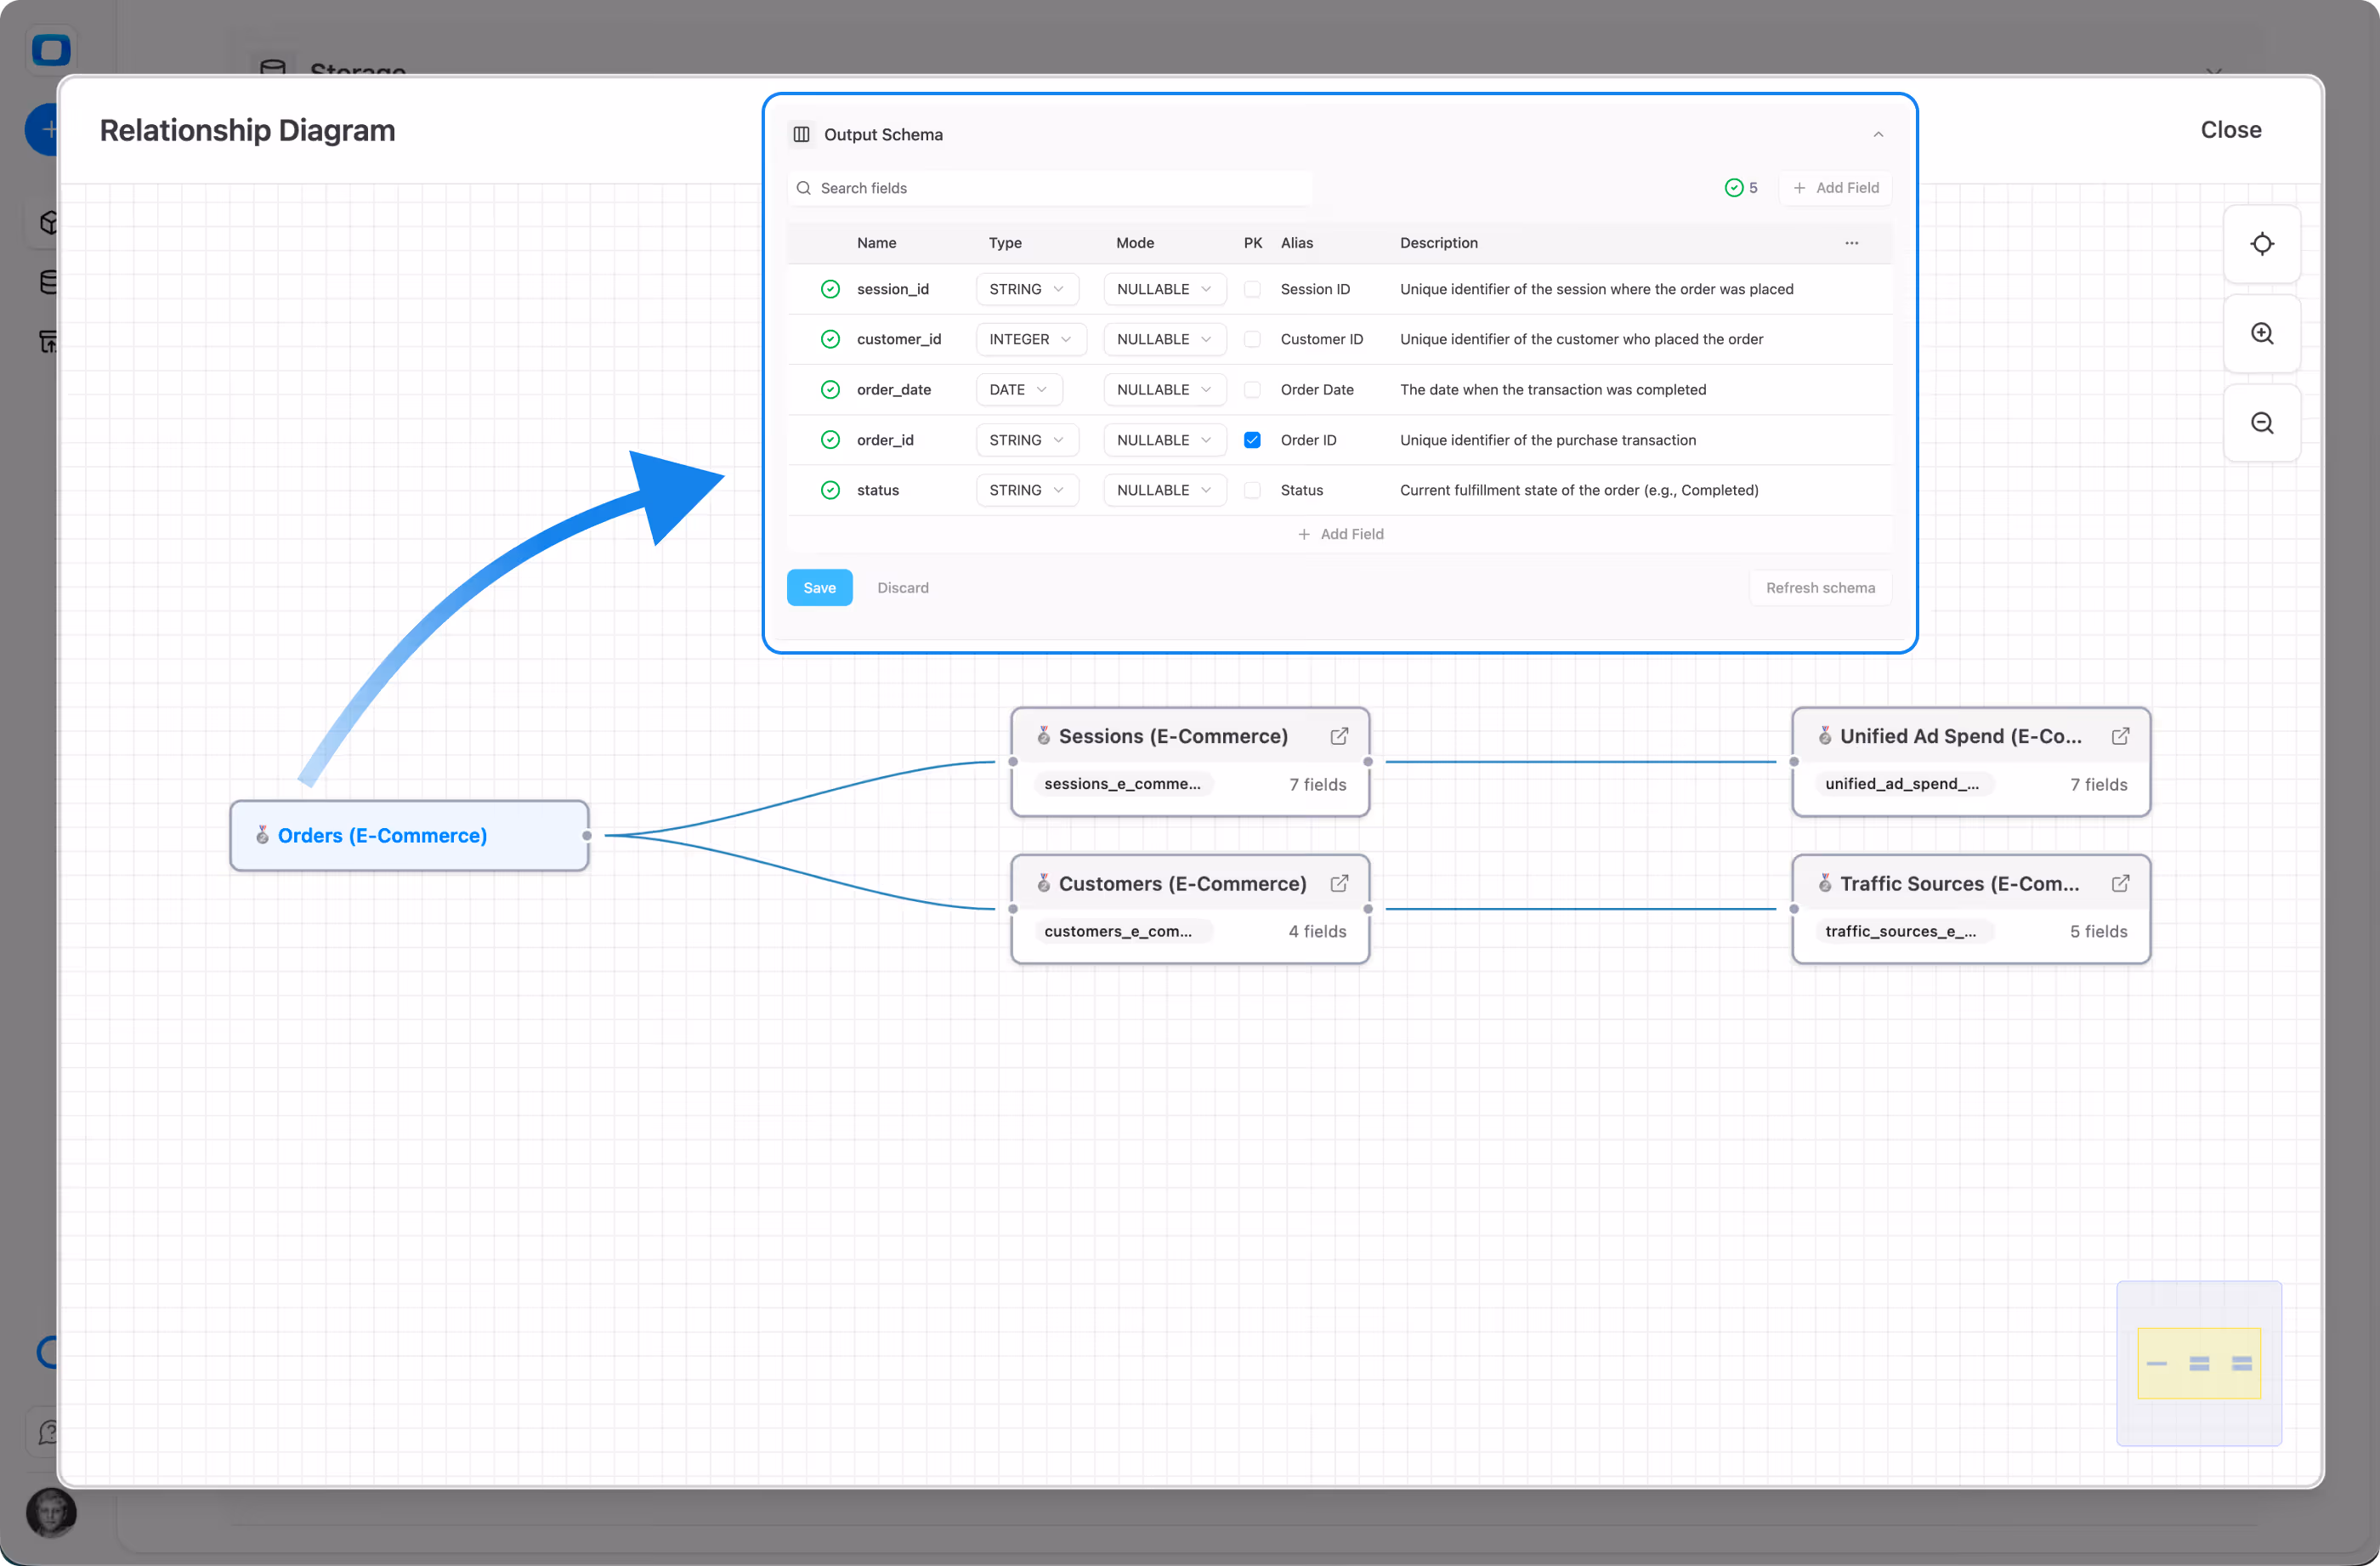
Get started free →Your data team joins ad platform data with revenue and CRM data, publishes it as a governed library. Your marketing team sees business-friendly names, not raw tables.
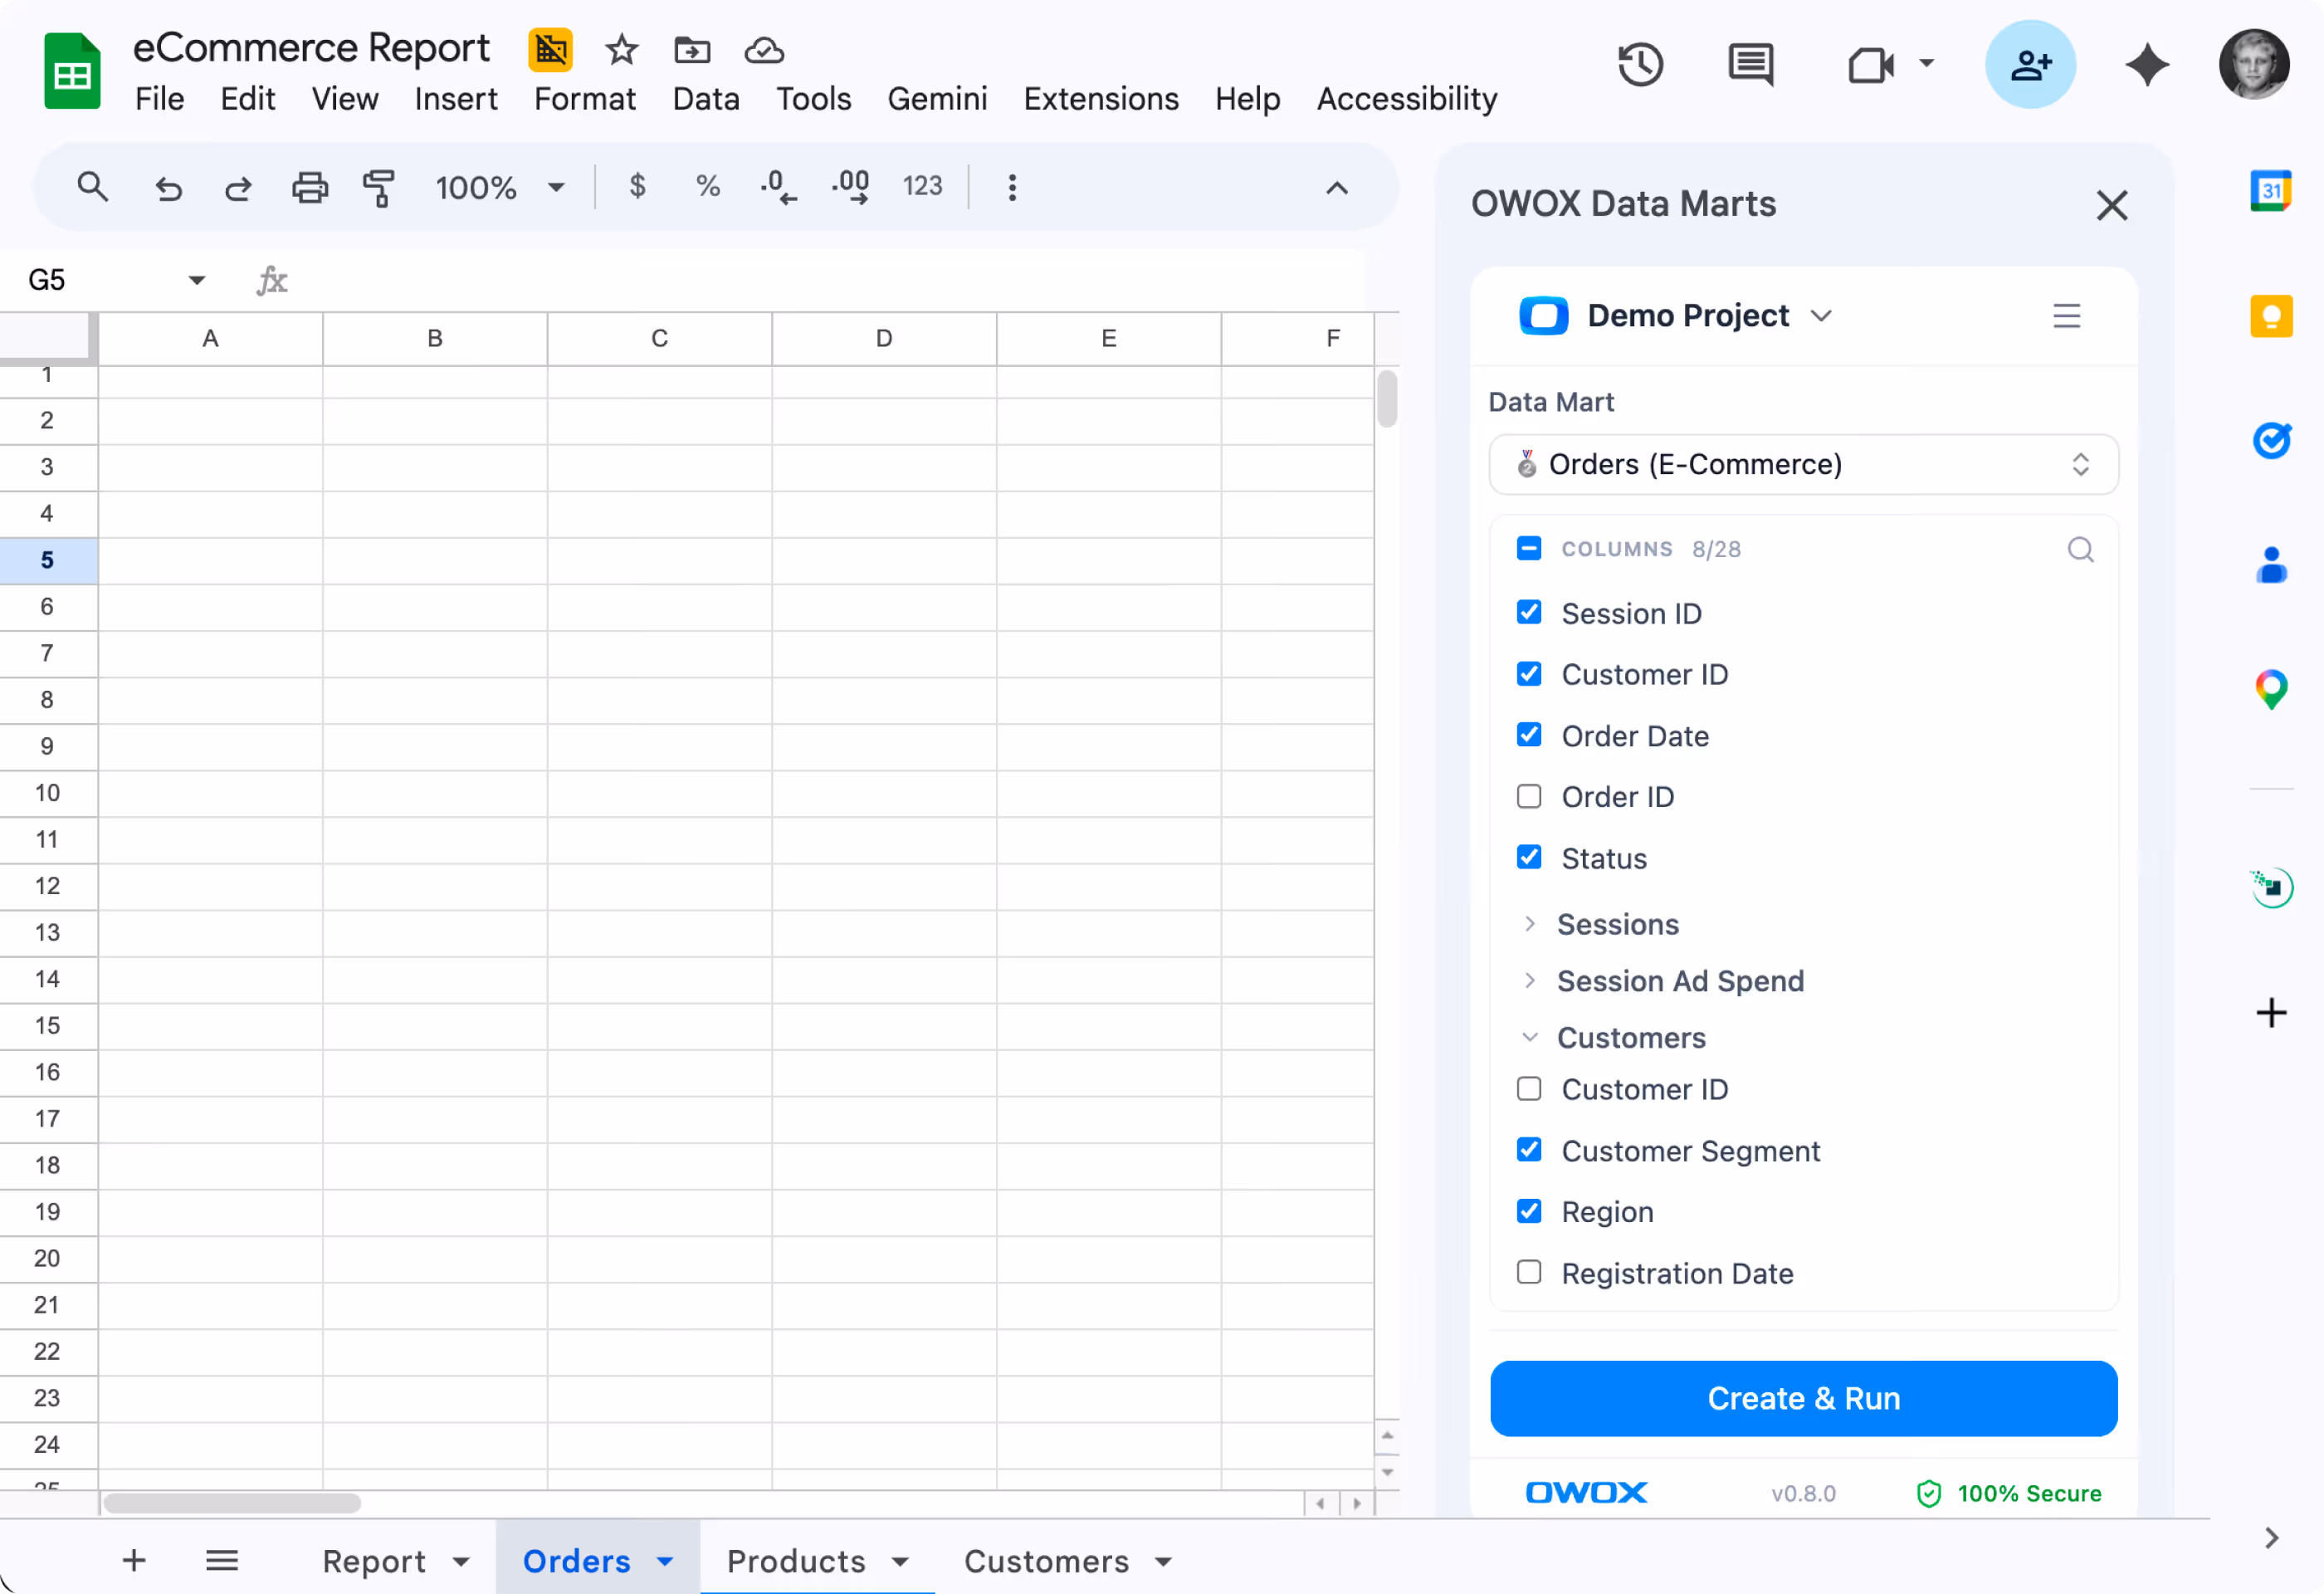
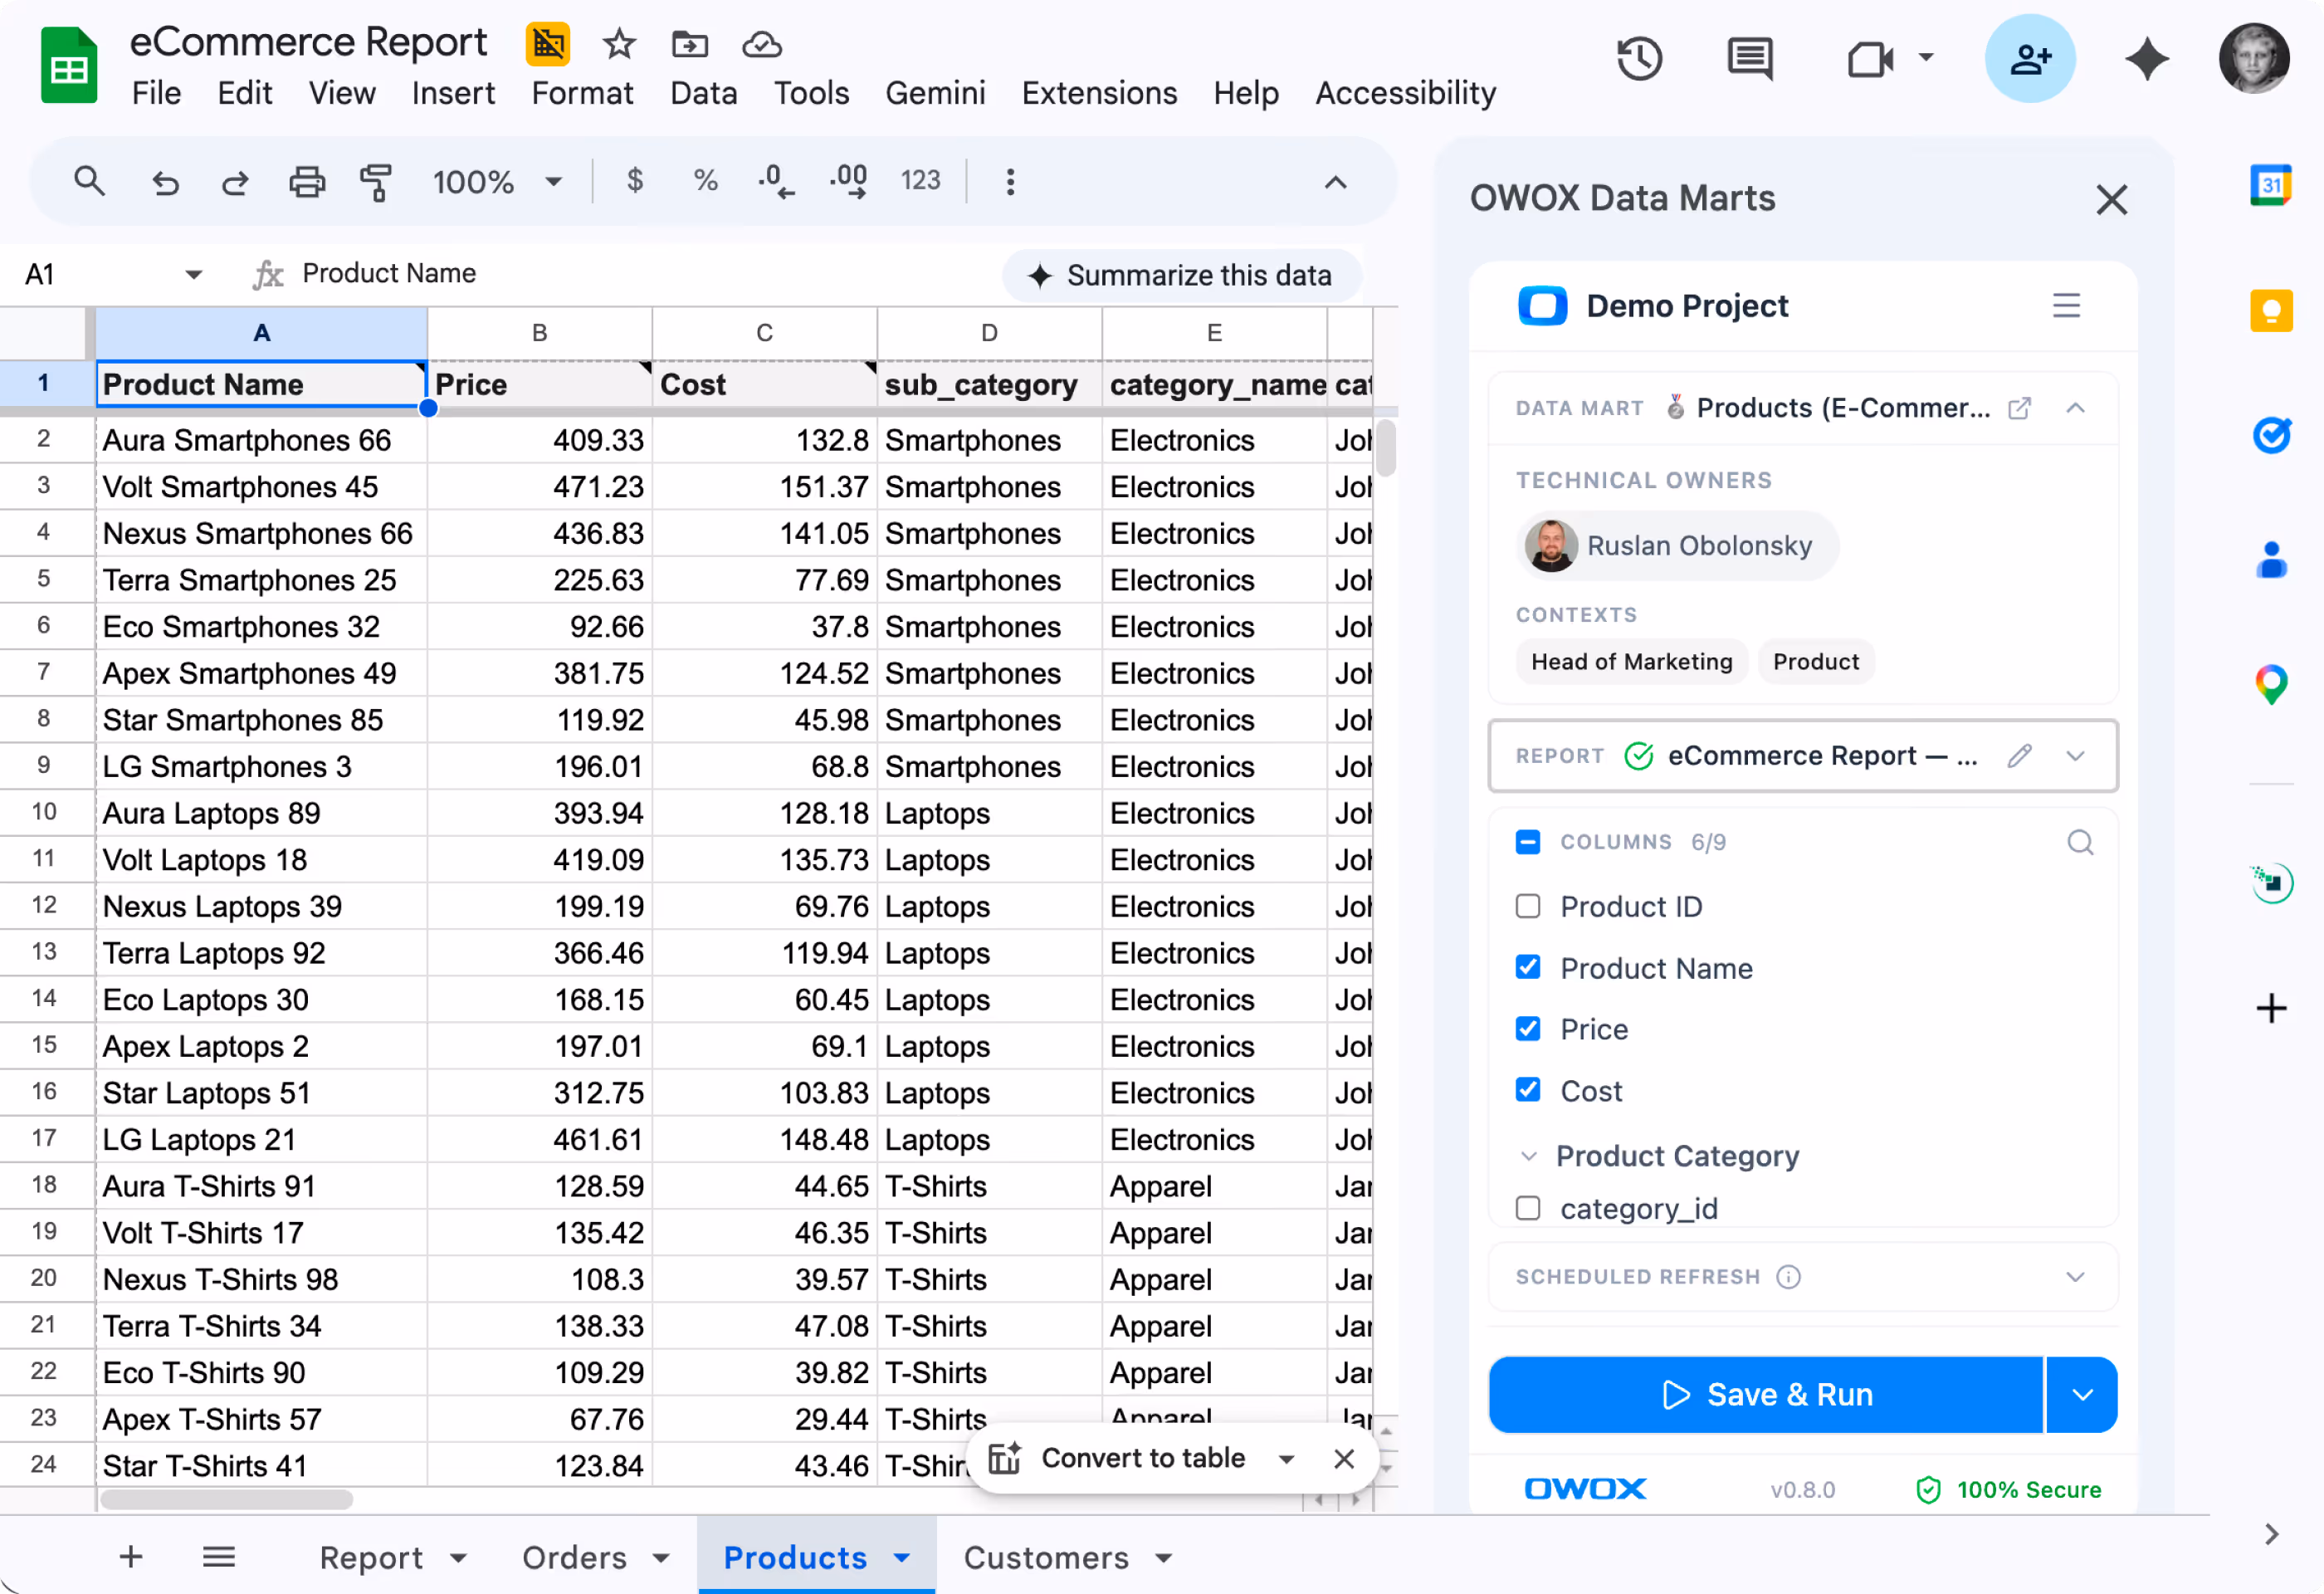
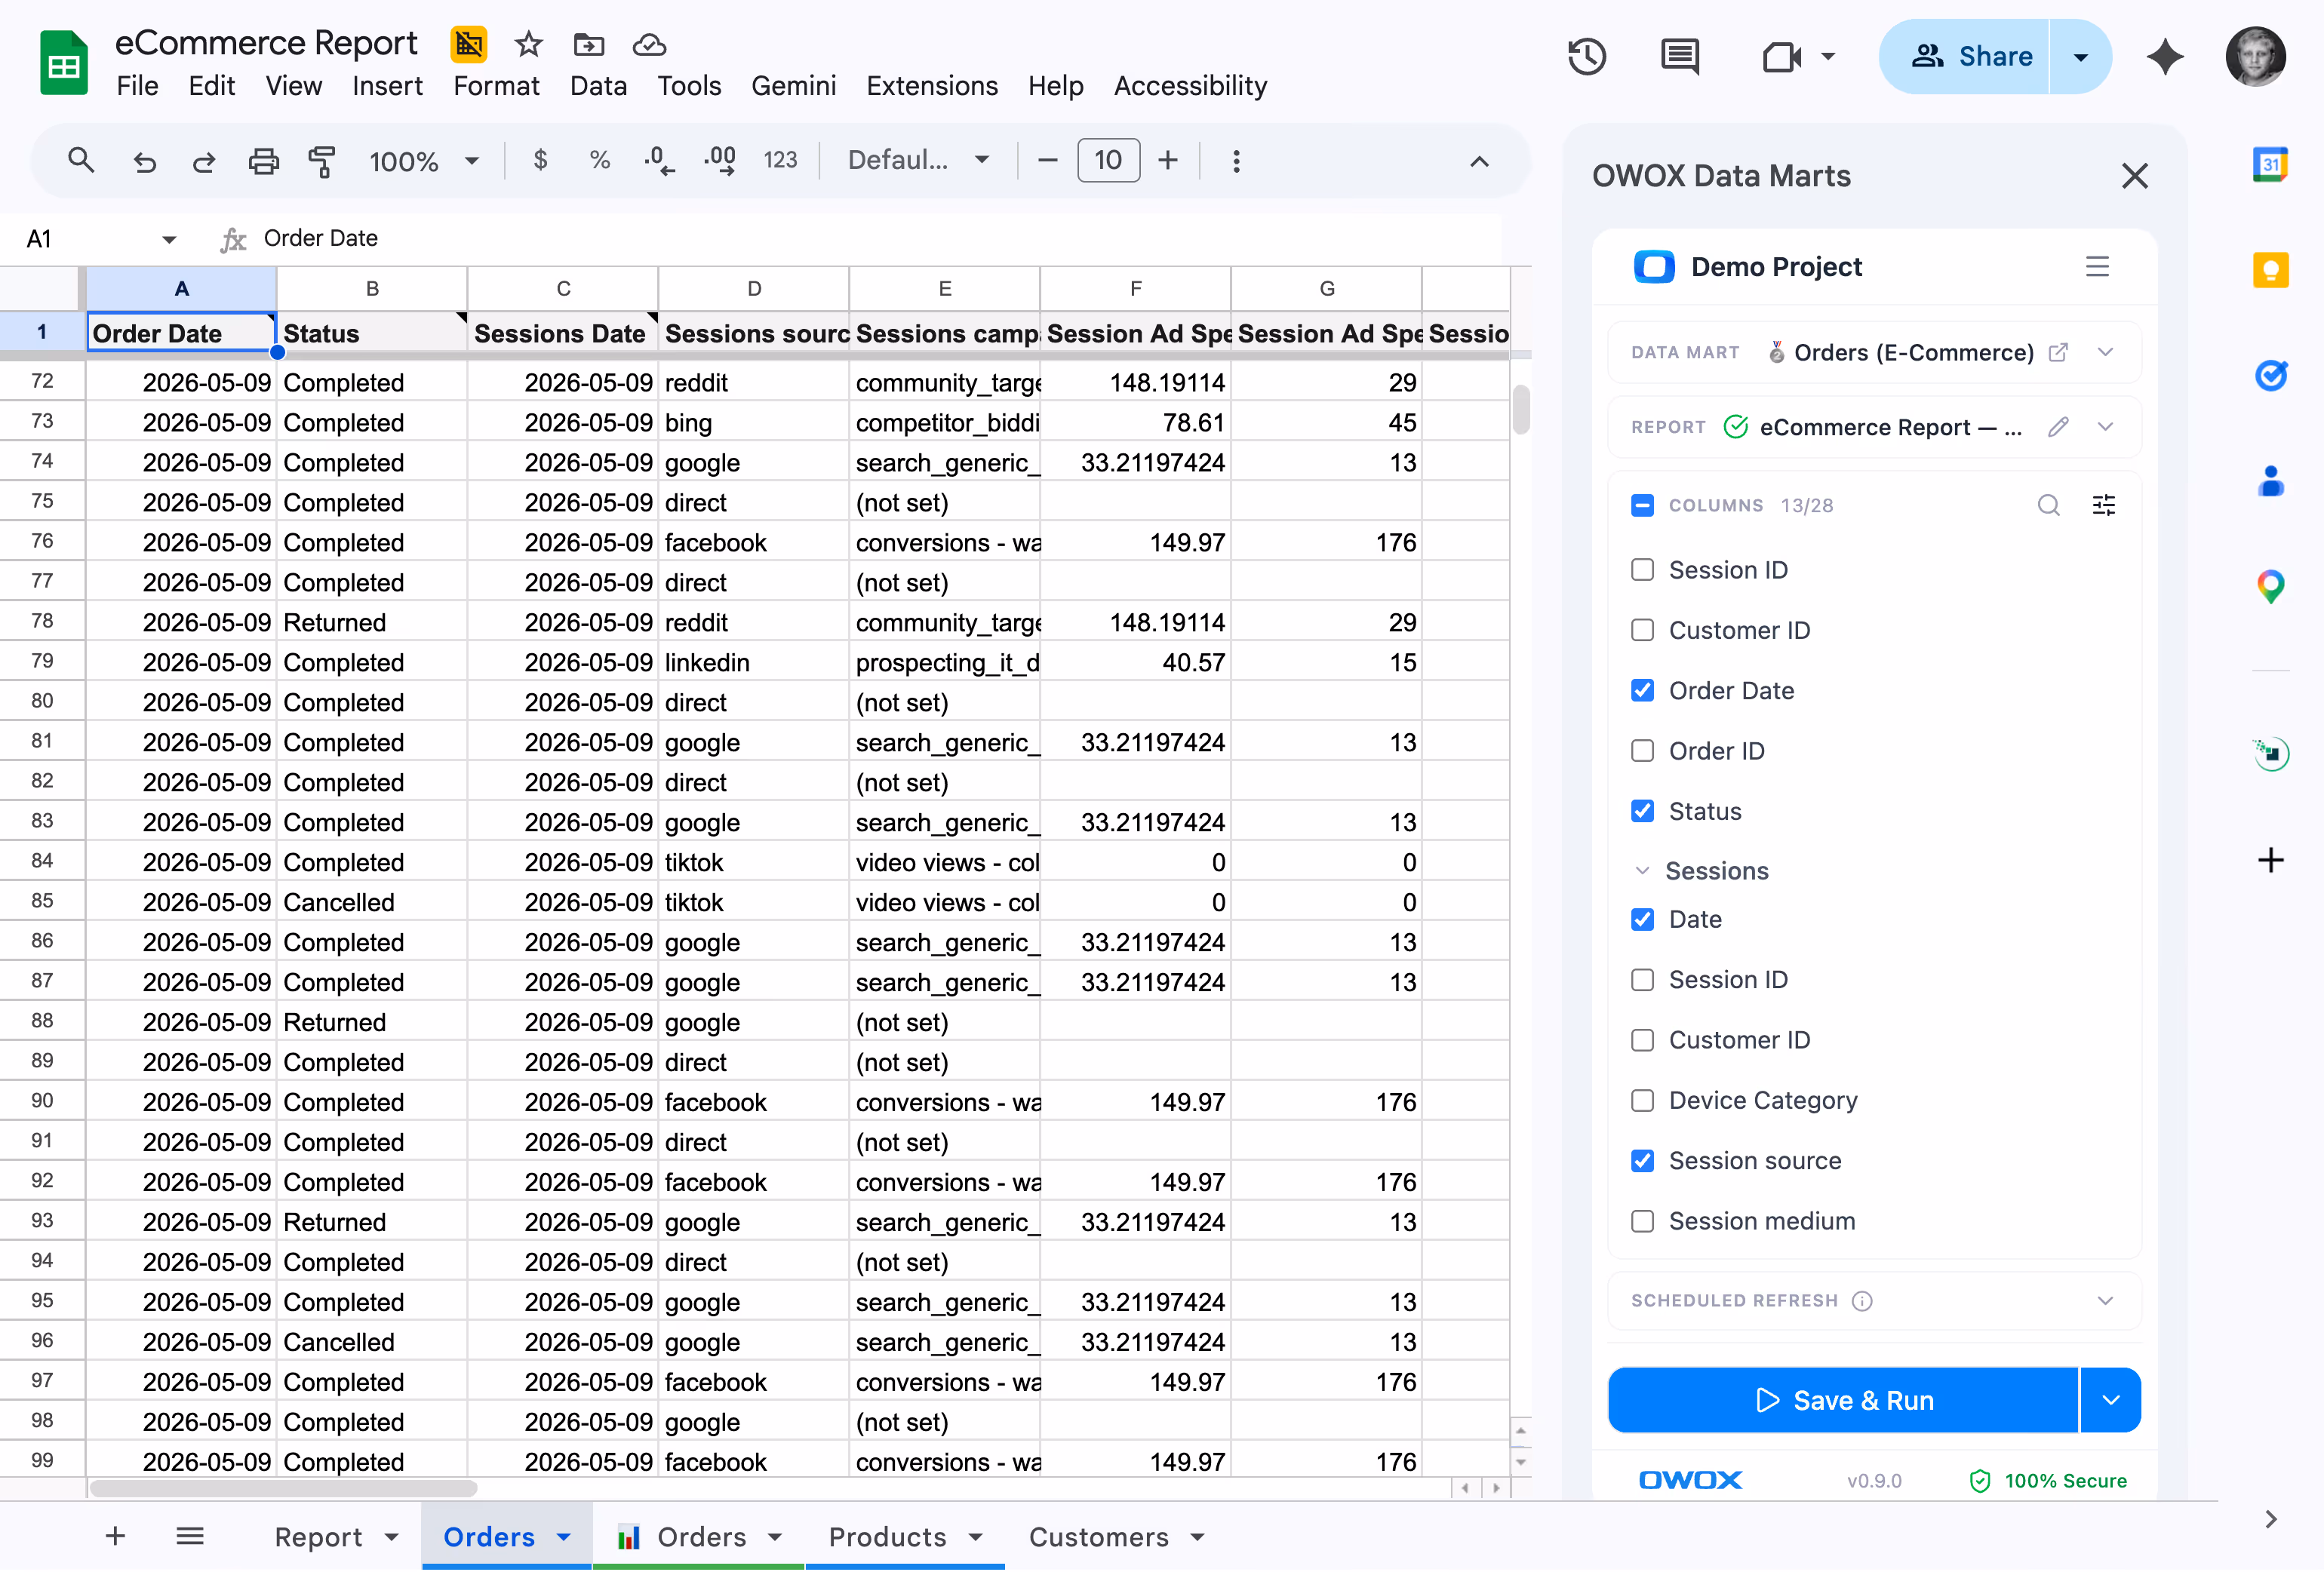
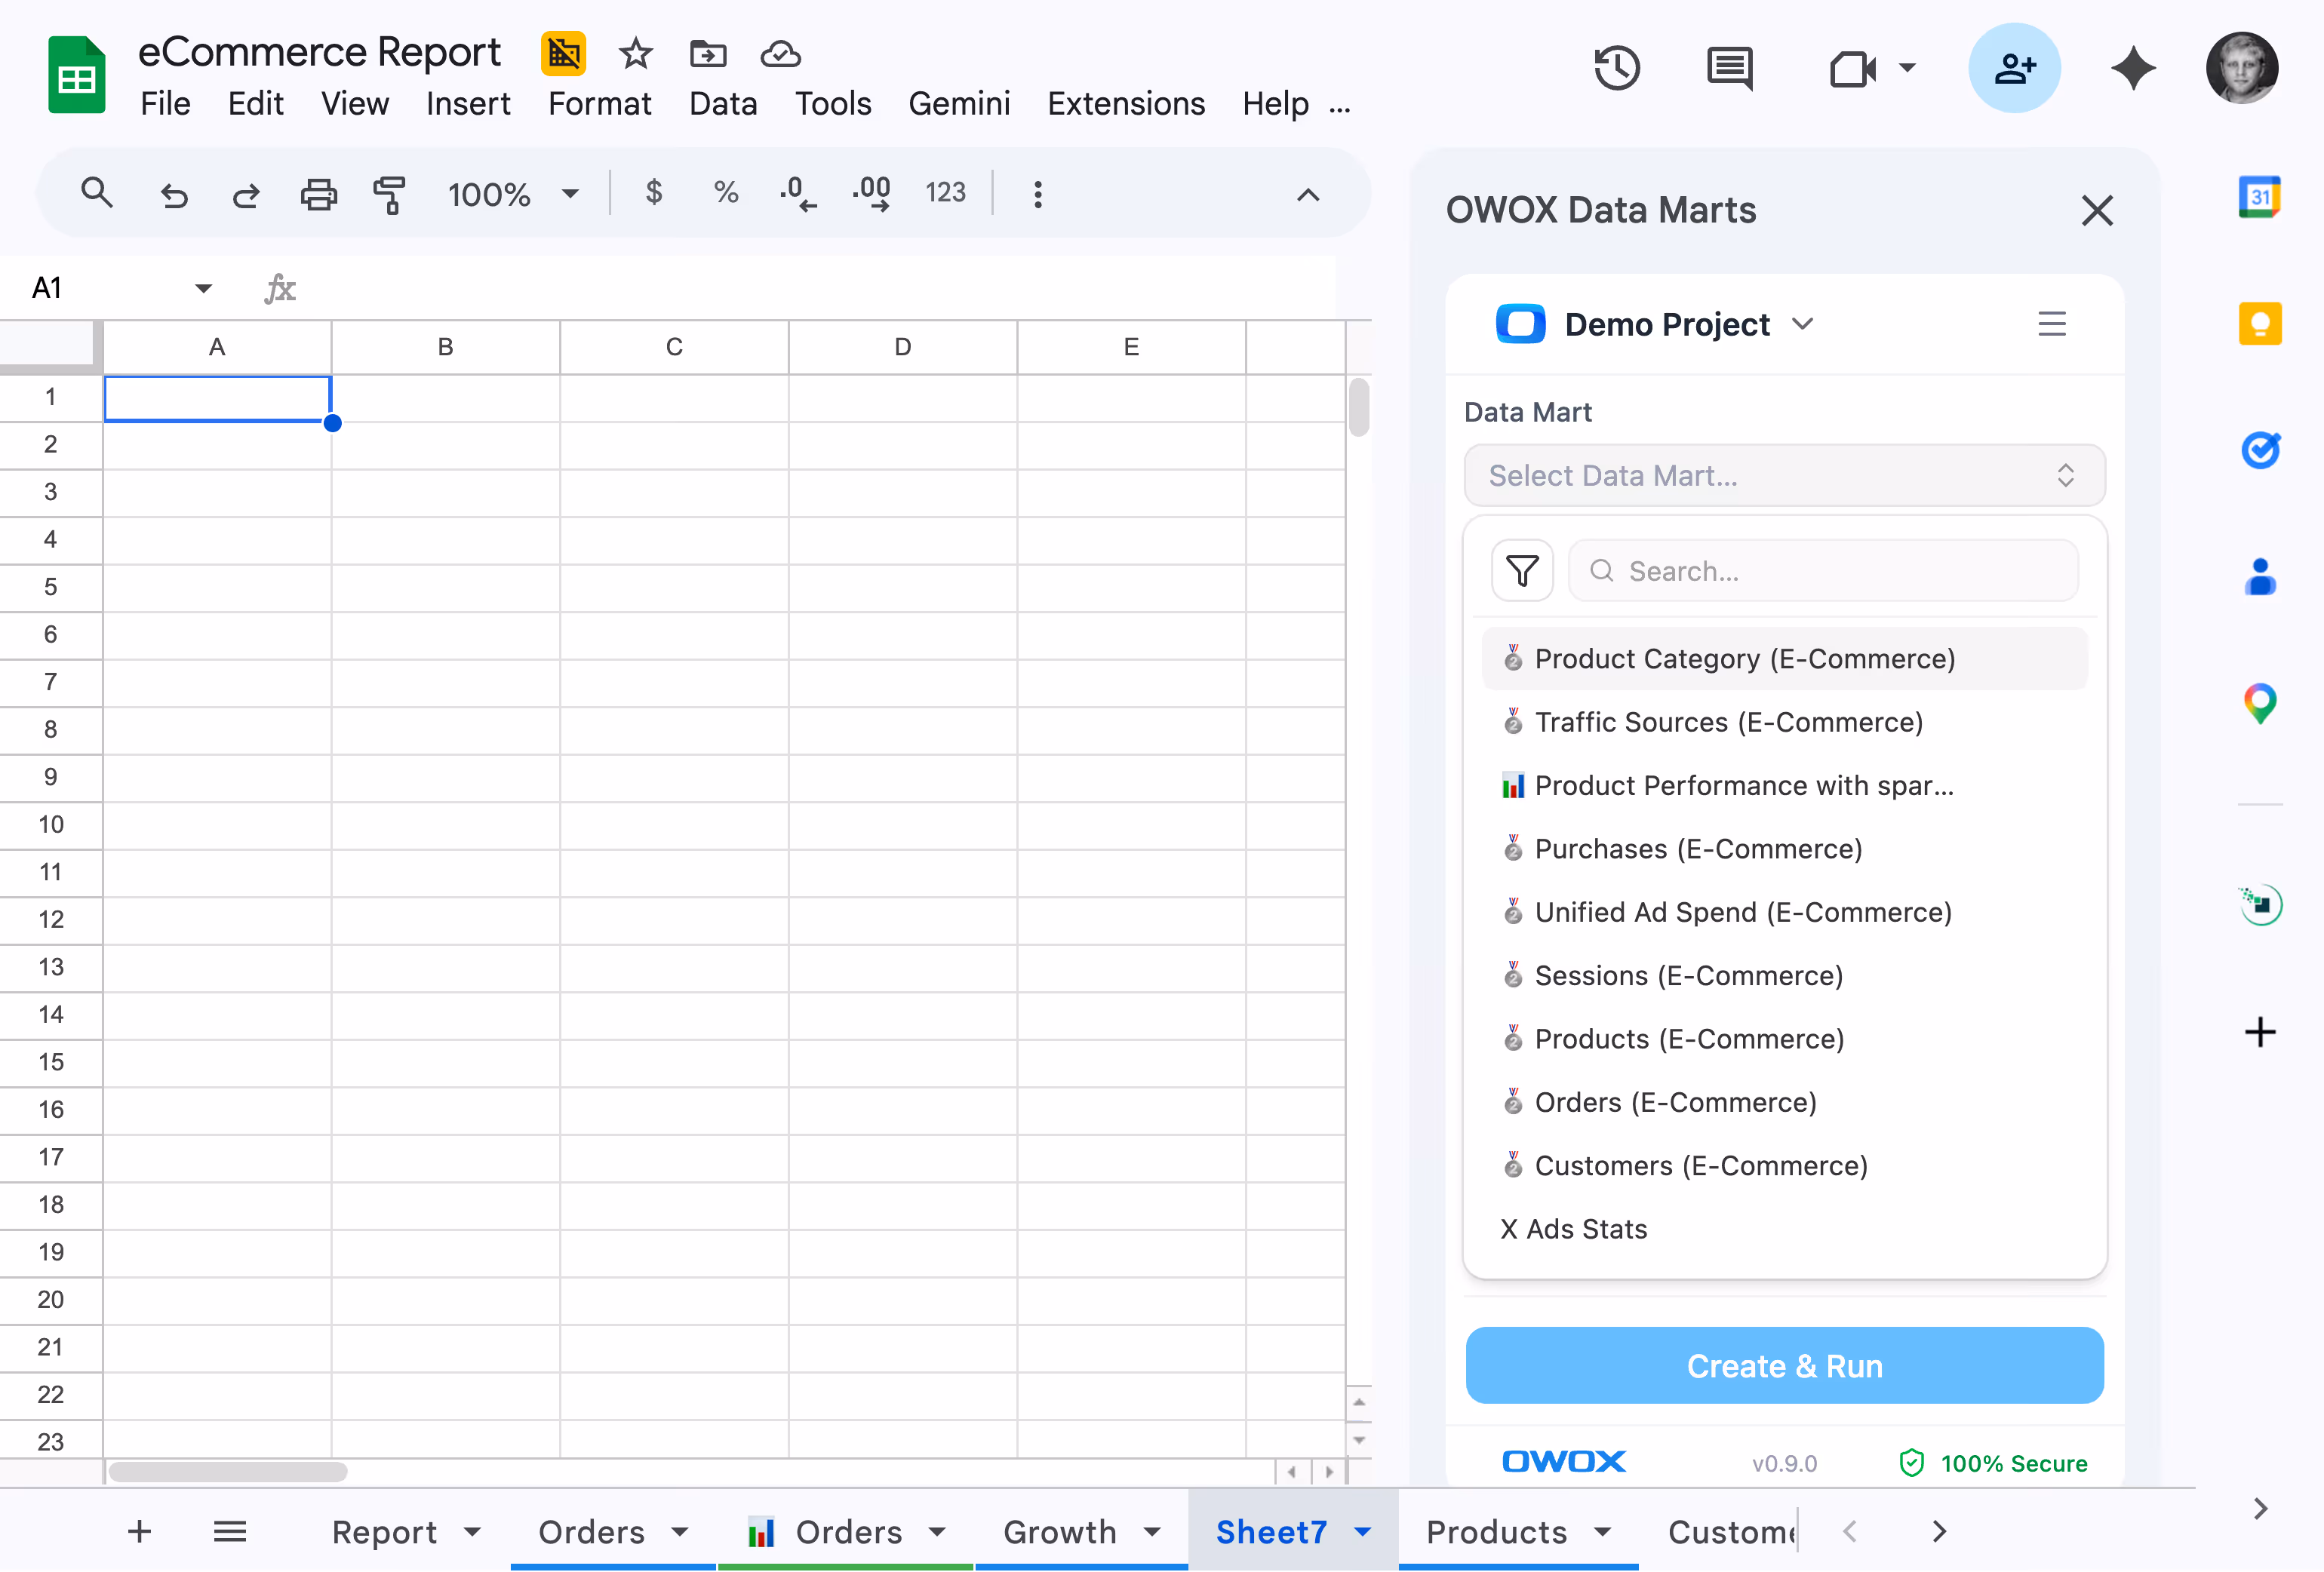
The OWOX sidebar puts the Data Mart library inside Google Sheets. Your campaign manager browses, joins, picks columns, and refreshes. No SQL. No analyst.
Insights turn your marketing Data Marts into recurring performance narratives delivered on schedule. AI writes the summary. Your analyst approved the SQL.
Send this page to your data team. They’ll build the marketing library. Your team self-serves in Sheets before Friday.
Your data team builds the marketing library. Your marketing team self-serves from it. AI delivers performance briefs. The ticket queue empties.
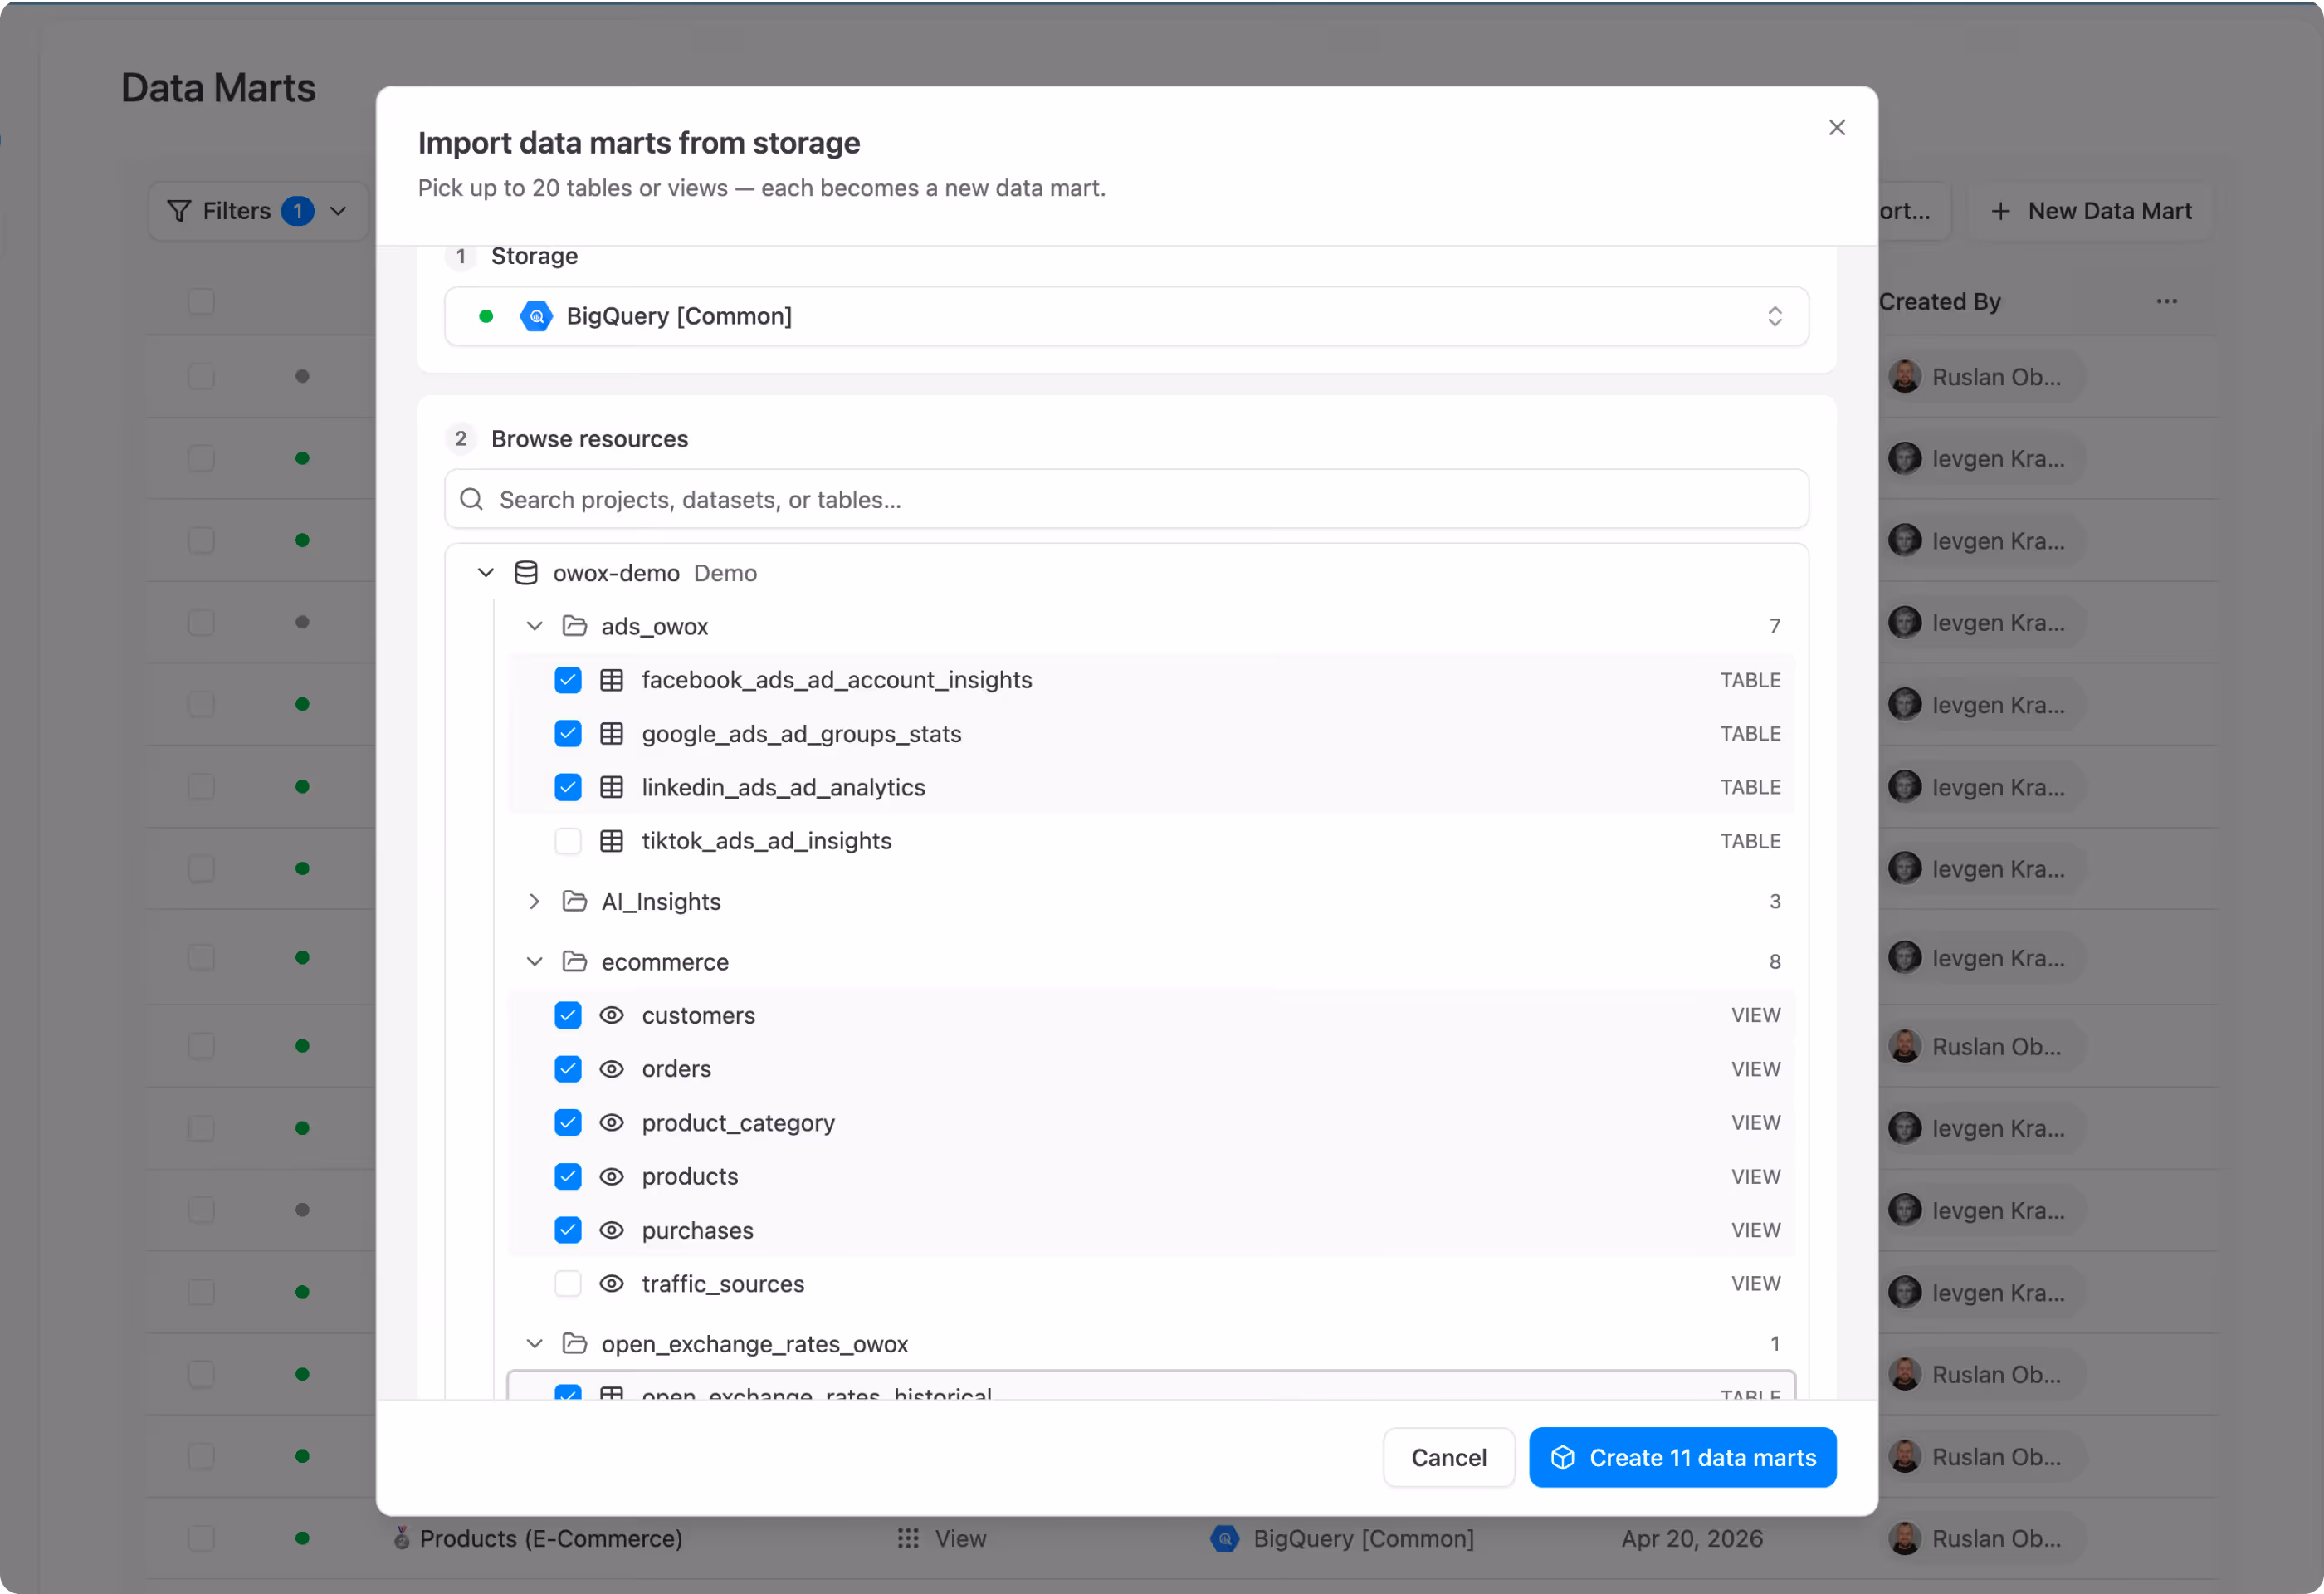
Connectors pull ad data into the warehouse. Your analyst joins it with revenue, publishes governed Data Marts.
Campaign managers open Sheets, browse the library, pick columns, filter by platform or region, refresh weekly.
Performance narrative — spend trends, ROAS changes, anomalies — to your Slack channel every Monday. Deterministic.
When your marketing team self-serves from governed Data Marts, everything shifts.
Cross-platform spend joined with actual revenue. When the CFO asks "is TikTok working?" – you answer with data.
Marketing and finance pull revenue from the same place. The board meeting goes smoothly because reconciliation doesn't happen at the meeting.
When the marketing team stops filing "pull this" tickets, your analyst finally has time for attribution modeling, incrementality testing, and media mix optimization.
Teams that gave their marketers direct access to governed data
Get started free, invite your data team (or someone technical). They’ll build the data mart library for you. Your team self-serves in Sheets. The ticket queue empties.
See how your marketing data flows from ad platforms to warehouse to Sheets — with your actual campaigns in mind.